Gleek Blog
Gleek continues to enhance your diagramming capabilities with its 2025 update, including upgraded diagrams, Gantt chart support in Gleek AI, chat history for diagrams, and iterative editing.

Nika
29 April 2025
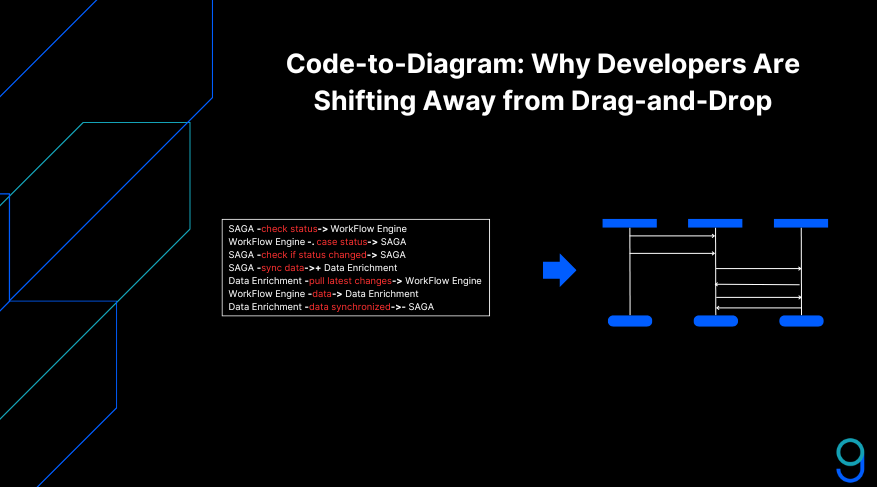
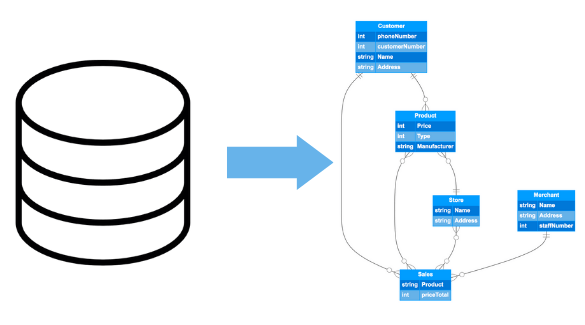
By allowing developers to generate diagrams directly from structured code, code-to-diagram tools offer a faster and more efficient alternative. There's no need for endless tweaking or rearranging; the diagrams update automatically as the code changes, which saves time and brings consistency and accuracy across projects.

greg
20 January 2025
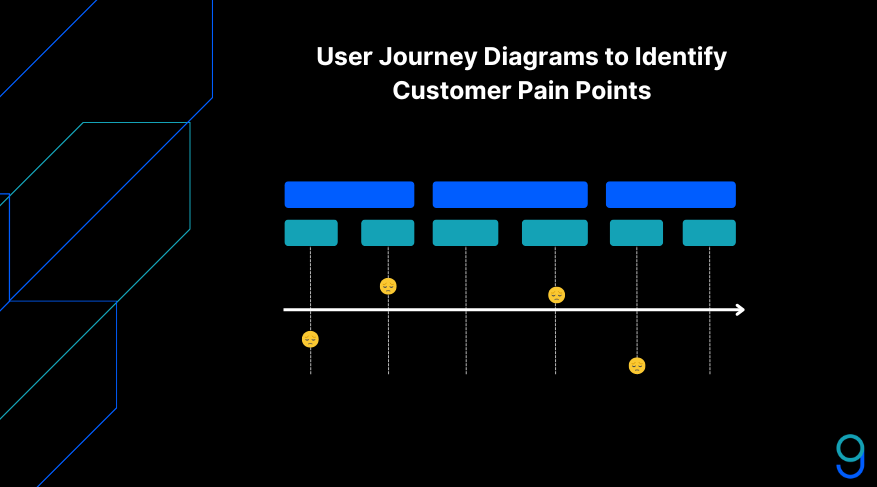
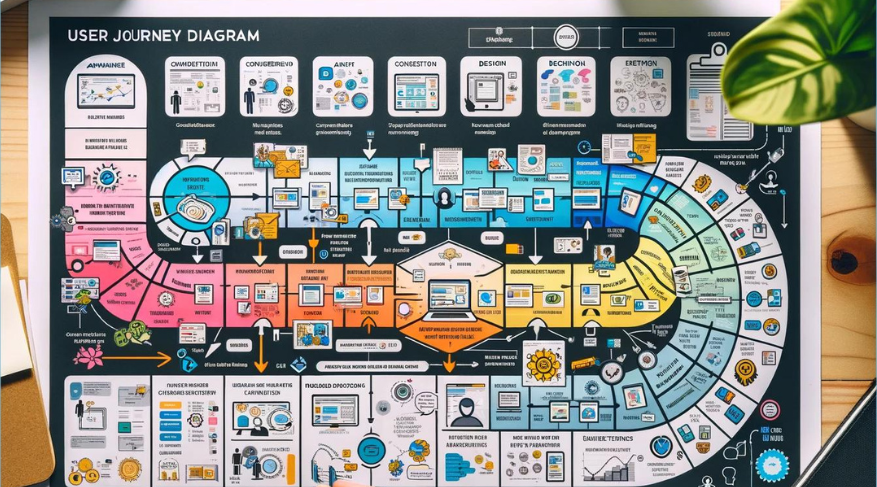
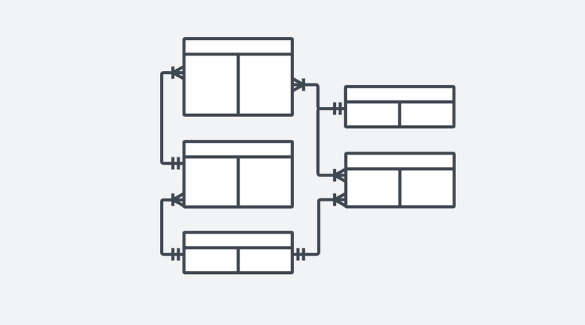
User journey diagrams are not just about visualization; they are a powerful analytical tool that reveals hidden pain points and inefficiencies in the customer experience. These diagrams allow businesses to see the journey from the customer's perspective, identifying moments that may cause frustration or confusion.
greg
17 January 2025
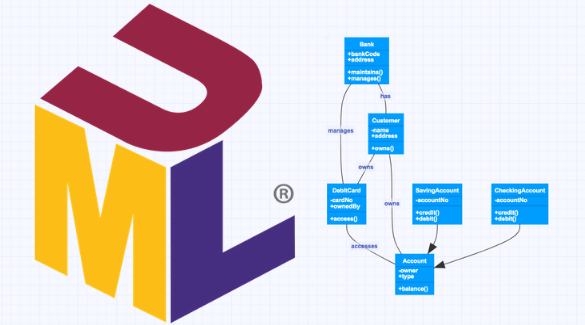
Among the most popular tools when it comes to visual representations of complex data interactions, architectural frameworks, and class hierarchies, are Mermaid and PlantUML. Let's see how these tools stand in comparison.
greg
09 January 2025
Diagram-as-code tools provide developers with the means to visualize intricate systems effectively. These tools ensure that visual representations remain up-to-date and accurately mirror the project's current state, which is essential in agile and fast-paced development settings. When selecting the right tool, consider factors such as the complexity of your projects, the collaboration needs of your team, and how well a tool integrates with your existing workflow.
greg
29 December 2024
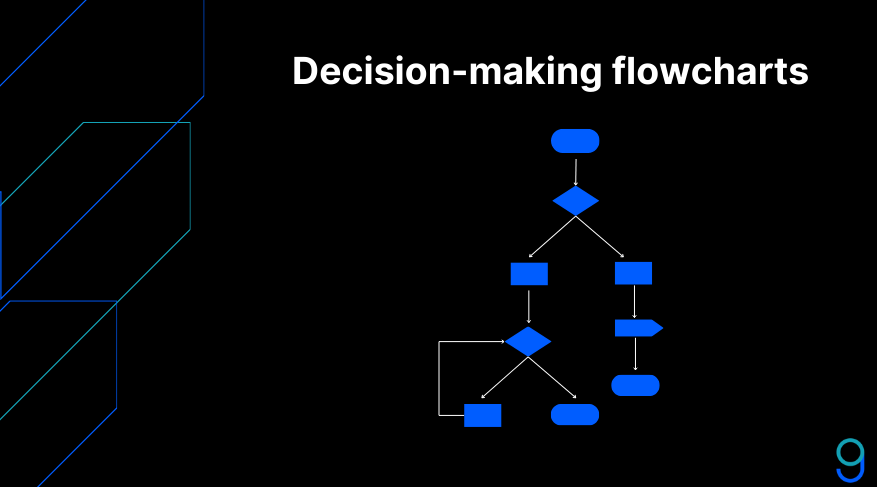
By breaking down each component of a decision, flowcharts provide a roadmap that illustrates potential paths and consequences. Flowcharts are instrumental in mapping out different options and their consequences, serving as a foundation for more detailed discussions. They allow users to explore "what-if" scenarios, weighing the pros and cons of each path before committing to a course of action.
greg
26 December 2024
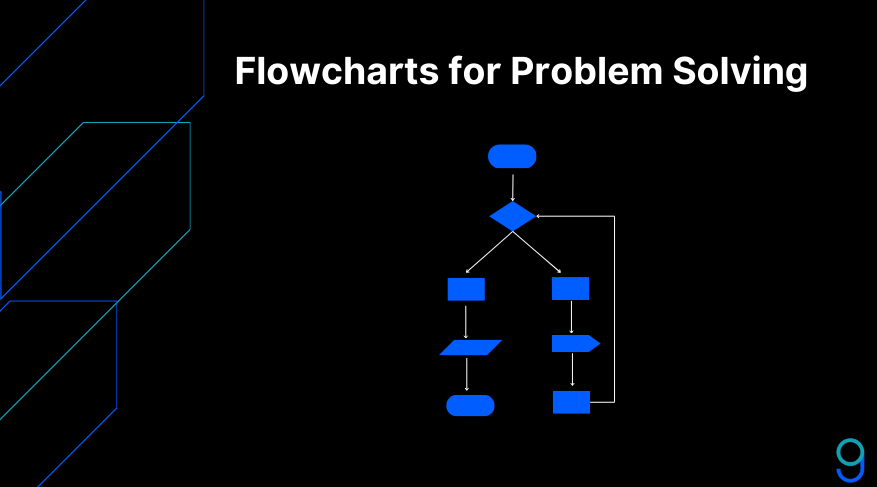
Used widely in programming, flowcharts help visualize algorithms and troubleshoot code. In business, they simplify processes like customer service and supply chains, ensuring efficiency. Even in daily life, flowcharts clarify decision-making by mapping options and outcomes. By providing a clear process roadmap, flowcharts help users to analyze and refine tasks.
greg
25 December 2024
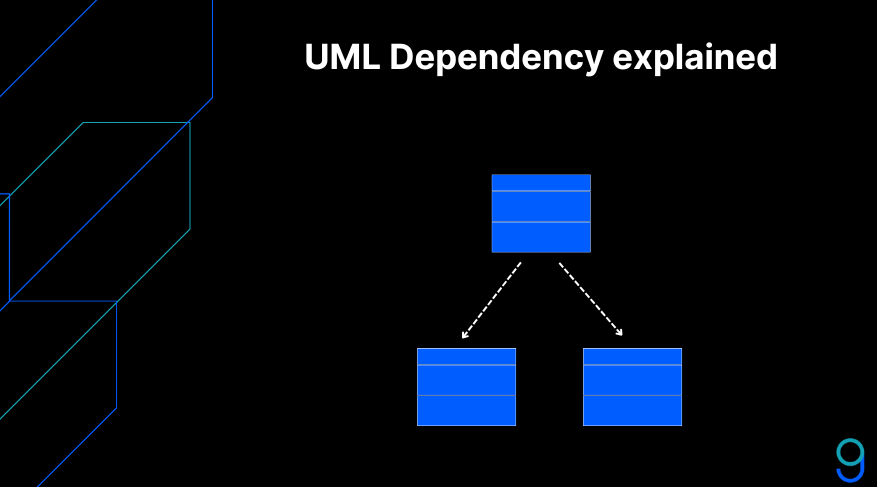
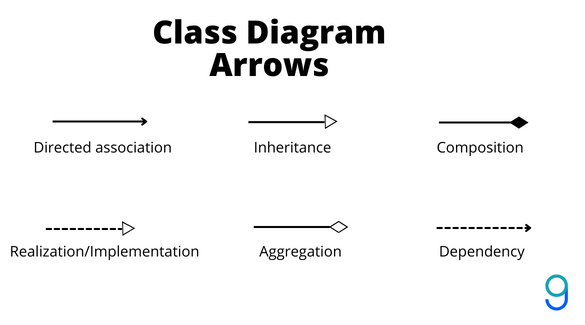
In UML, dependencies are vital for defining how elements within a system interact and rely on each other. Understanding the various types of dependencies helps developers craft a more resilient and maintainable architecture. Several key types of UML dependencies include usage dependencies, abstraction, realization, and refinement.

Constantine Nalimov
22 December 2024
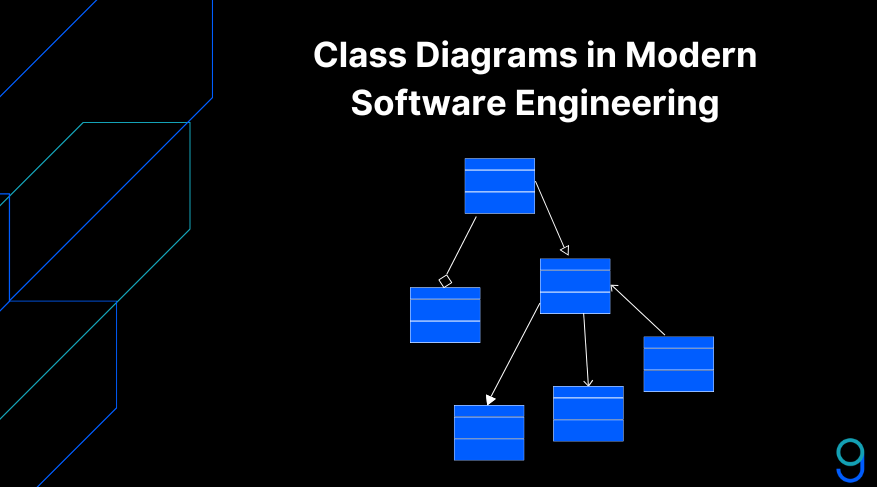
Class diagrams have long been foundational tools in software engineering, essential for structuring and visualizing system architecture. Traditionally, these diagrams serve as blueprints for organizing classes, attributes, operations, and relationships, making it easier for developers to understand and implement complex architectures.
Constantine Nalimov
21 December 2024
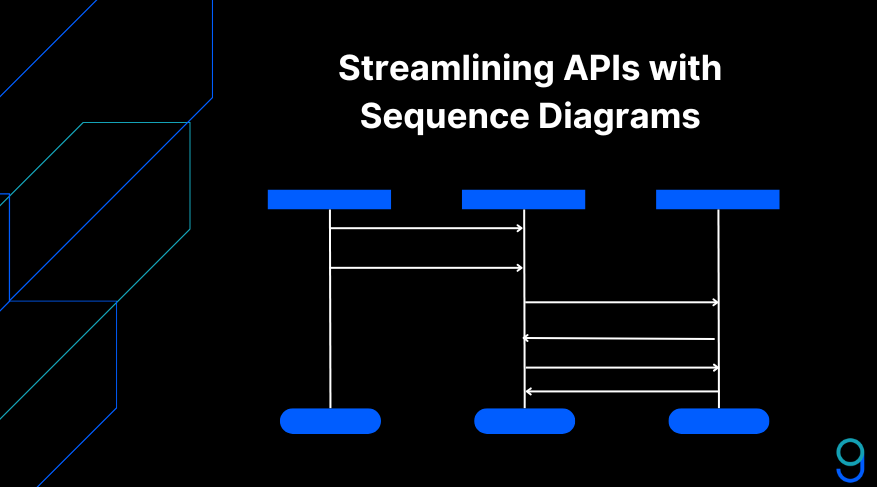
Sequence diagrams are crucial for visualizing interactions between services in API design within microservices architecture. They provide a clear, visual flow of data, aiding in the understanding of complex workflows and simplifying API integration. By depicting how components communicate, they help teams anticipate challenges and improve design efficiency.
Constantine Nalimov
20 December 2024
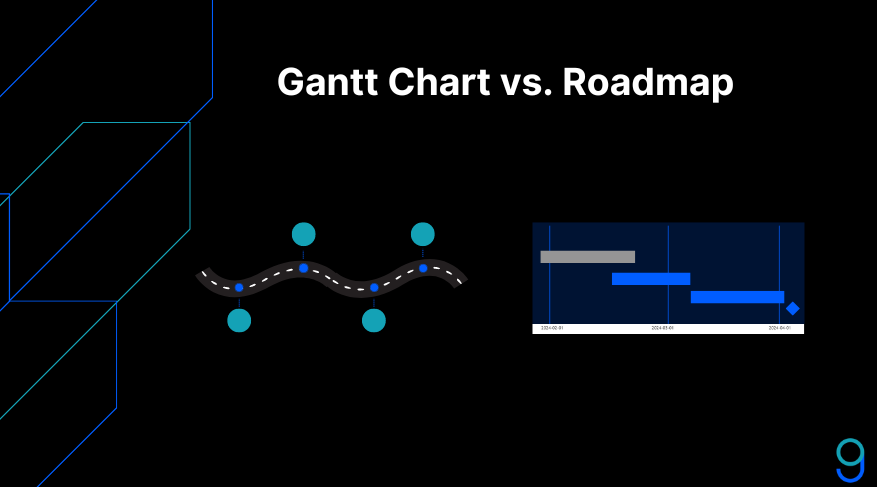
A roadmap offers a high-level, long-term view of a project, focusing on strategic goals and flexibility, ideal for aligning stakeholders. In contrast, a Gantt chart provides detailed task scheduling, emphasizing execution and timelines, and is suited for project managers overseeing daily operations.
greg
19 September 2024
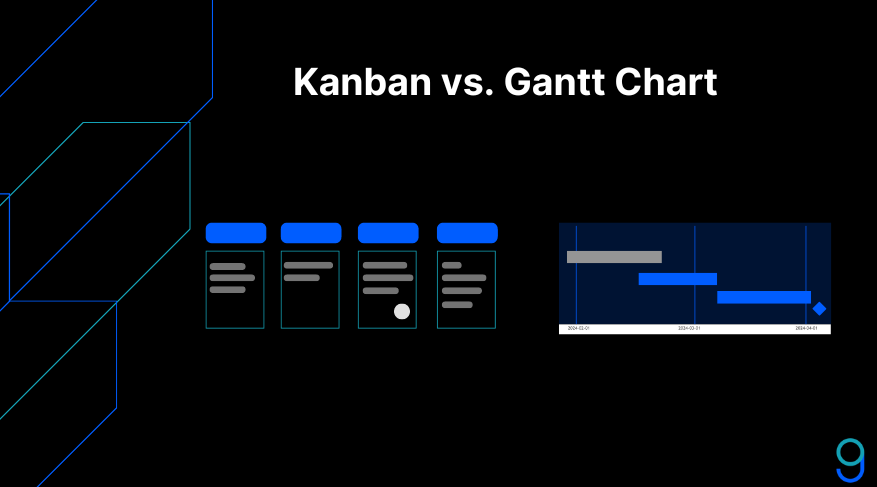
Choosing between Kanban and Gantt charts is crucial for effective project management. Kanban suits flexible, dynamic environments with ongoing tasks and shifting priorities, while Gantt charts are ideal for structured projects with deadlines and interdependent tasks.
greg
13 September 2024
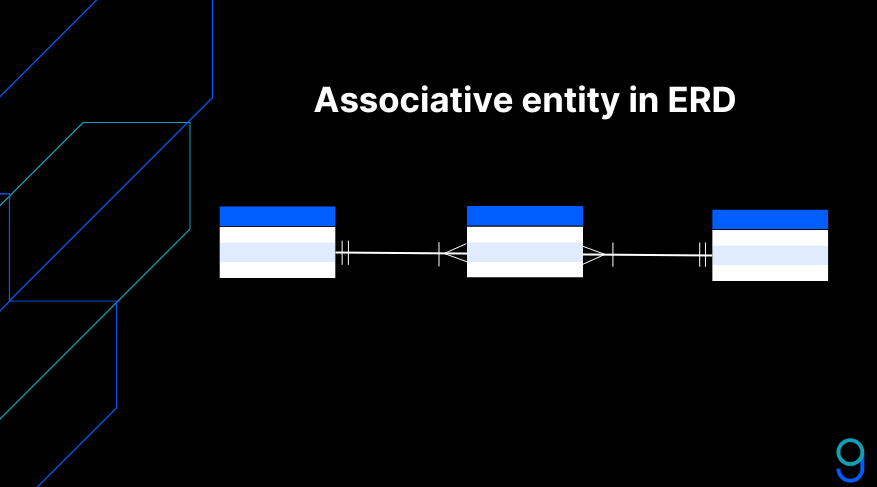
Associative entities help simplify complex relationships by breaking them down into more manageable one-to-many relationships. This not only normalizes the database but also helps eliminate redundancy, ensuring data consistency and integrity.
greg
28 August 2024
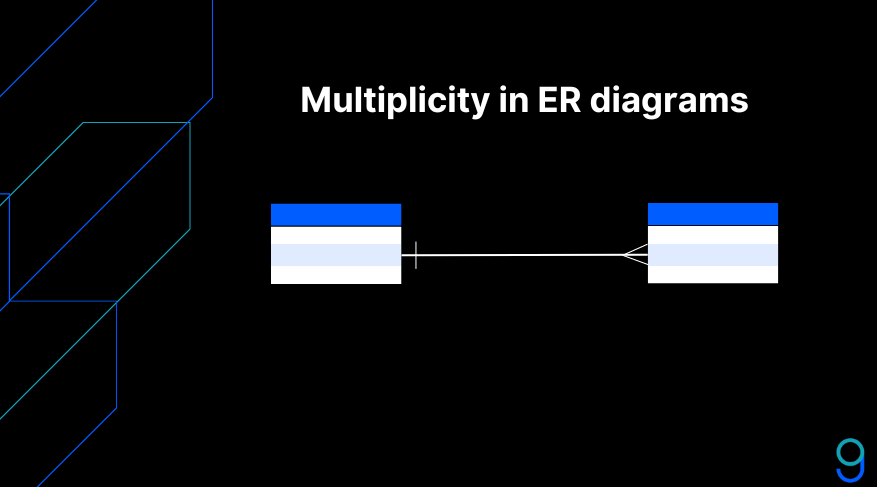
A key aspect of ER diagrams is the concept of multiplicity, also known as cardinality. Multiplicity defines the quantitative relationship between entities in a database. It specifies how many instances of one entity can be associated with instances of another entity.
greg
26 August 2024
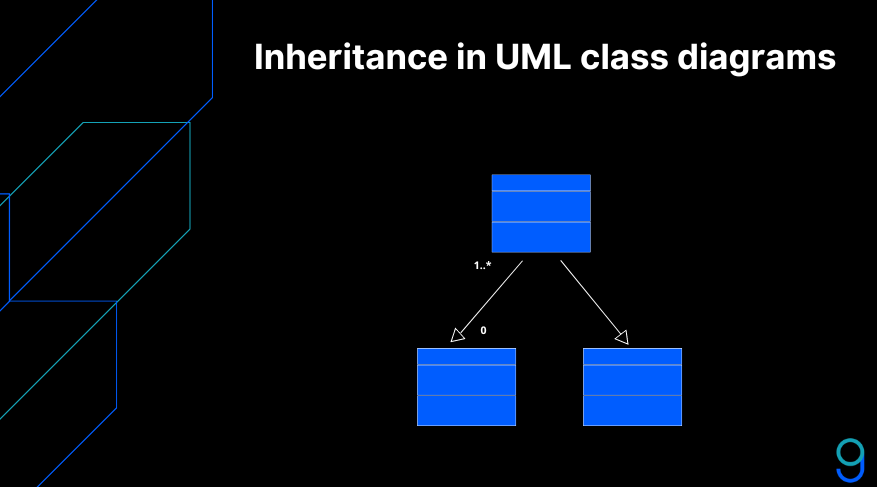
Inheritance in UML class diagrams is meticulously depicted to convey the hierarchical relationships between classes clearly and effectively. The inheritance line, or the generalization relationship, plays a central role in this representation.
greg
23 August 2024
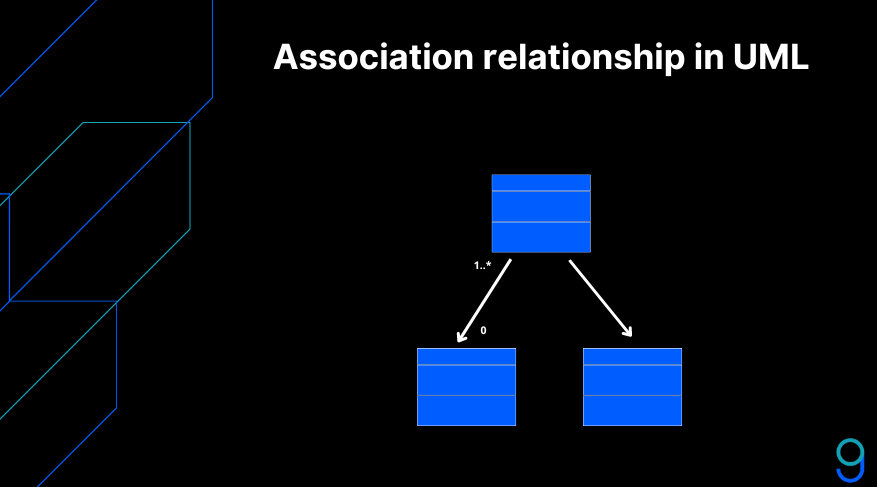
Association relationships are fundamental in UML because they help model the real-world interactions and dependencies between different entities in a system. By clearly defining these interactions, developers and designers can better understand and visualize the architecture of a software application.
greg
14 August 2024
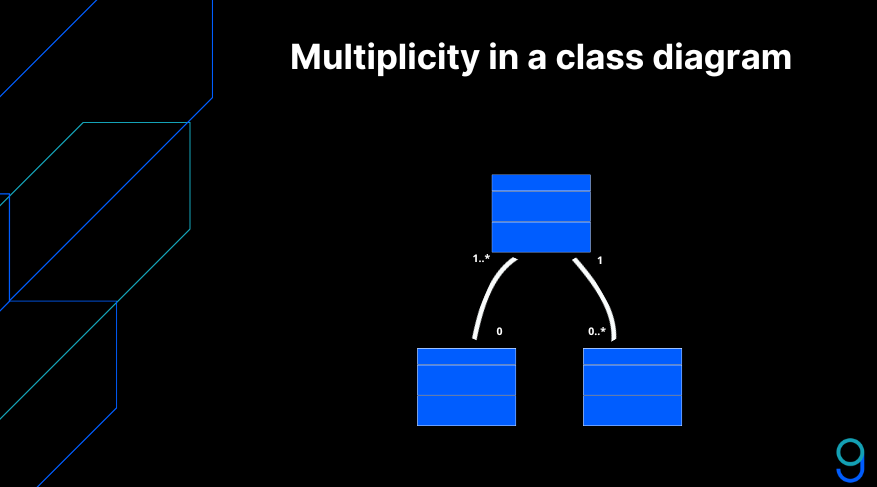
Multiplicity in UML class diagrams specifies the cardinality of relationships between classes. This tells you how many instances of a class can be linked to a single instance of another class.
greg
12 August 2024
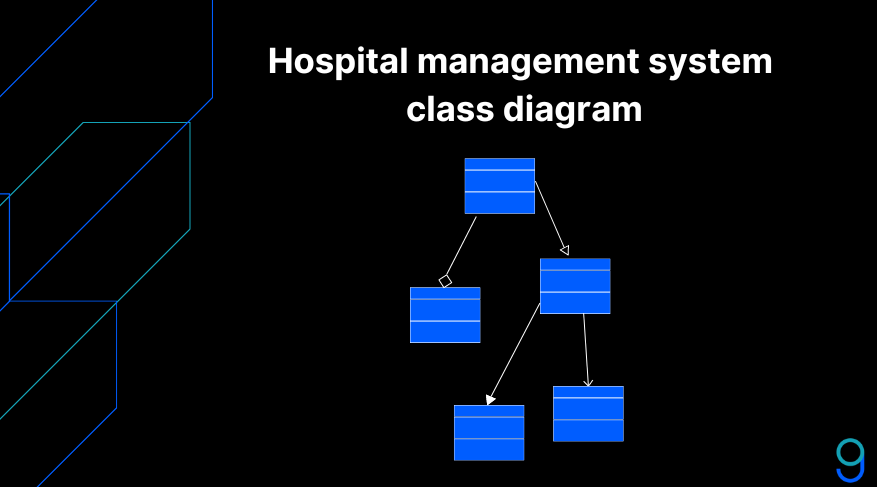
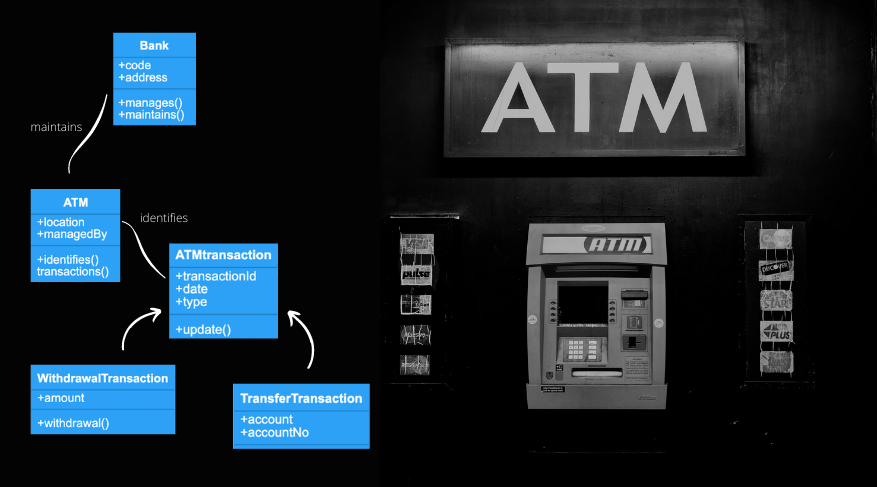
Creating a class diagram for these components not only clarifies the structure and interconnections of the hospital management system but also enhances the understanding and communication among developers, hospital administrators, and other stakeholders.
Constantine Nalimov
29 May 2024
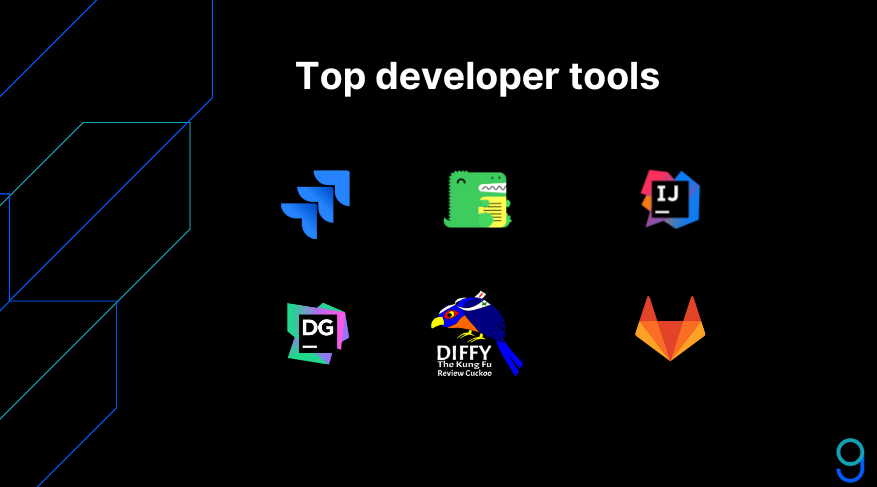
This article explores developer productivity tools, examining their importance in optimizing coding practices, project management, and overall development processes. By understanding the role these tools play in modern software development, developers can utilize their capabilities to boost productivity, improve code quality, and achieve project milestones more effectively.
greg
23 May 2024
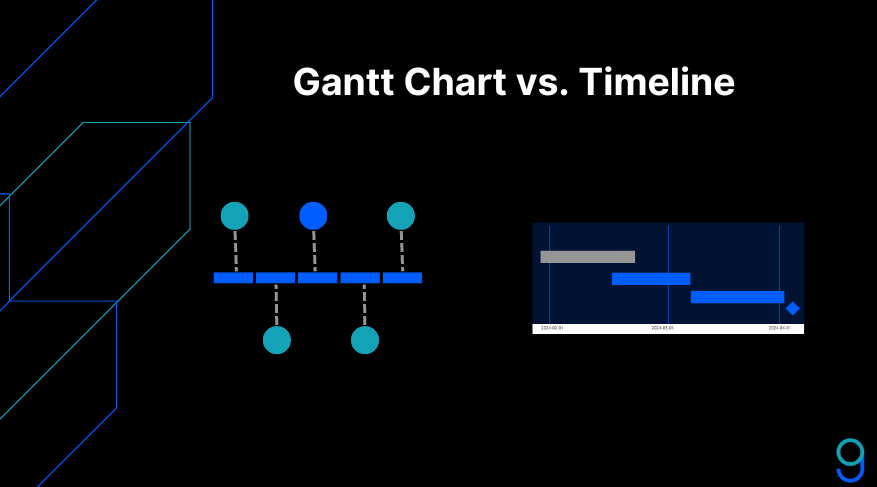
Beyond timeline charts, Gantt charts, and project calendars emerge as particularly prominent for their widespread use and versatility. Understanding the key differences between these tools can empower project managers to choose the most suitable option for their projects.
greg
23 May 2024
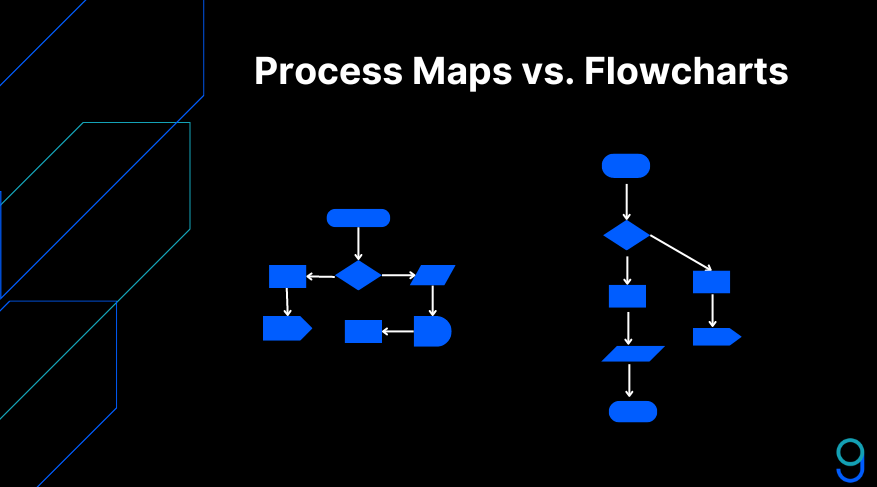
Process maps and flowcharts serve a specific purpose, catering to different needs within an organization’s process visualization efforts. Process maps offer a comprehensive view, ideal for deep dives into complex systems, facilitating detailed analysis and continuous improvement.
greg
19 May 2024
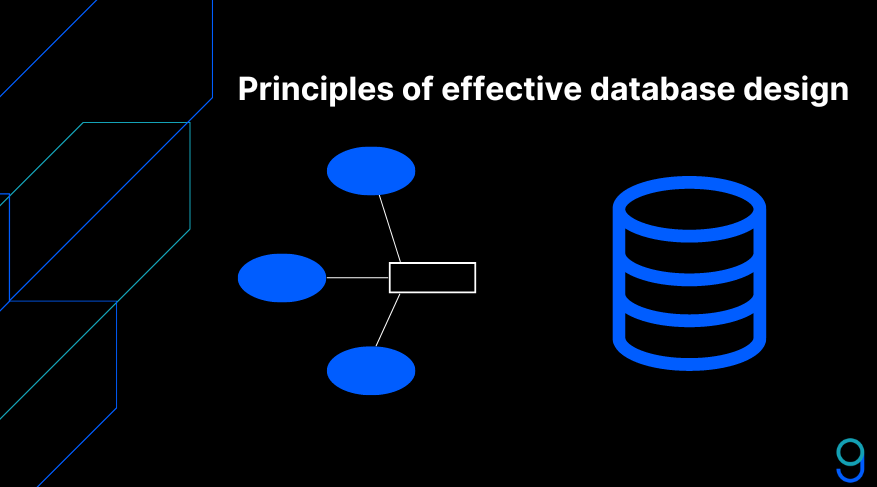
In this article, we'll explore the principles behind effective database design, laying a foundation for systems that are not only efficient and scalable but also user-friendly. Let's see how these principles can be applied to create robust databases that meet today's dynamic demands.
greg
17 May 2024
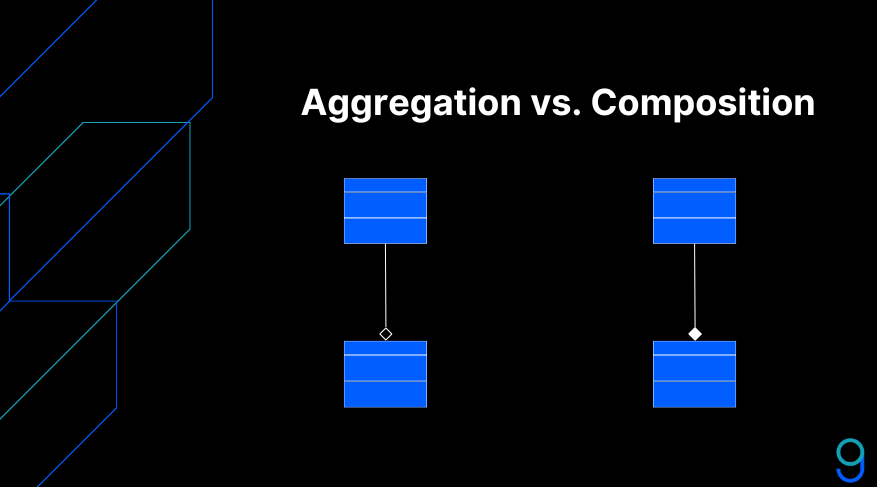
Central to UML's effectiveness is its capacity to illustrate different types of associations, notably aggregation and composition. These concepts are vital for understanding how objects relate to one another, influencing the system’s structure and behavior. Accurately representing these relationships allows for logical, coherent designs that meet project requirements effectively.
greg
16 May 2024
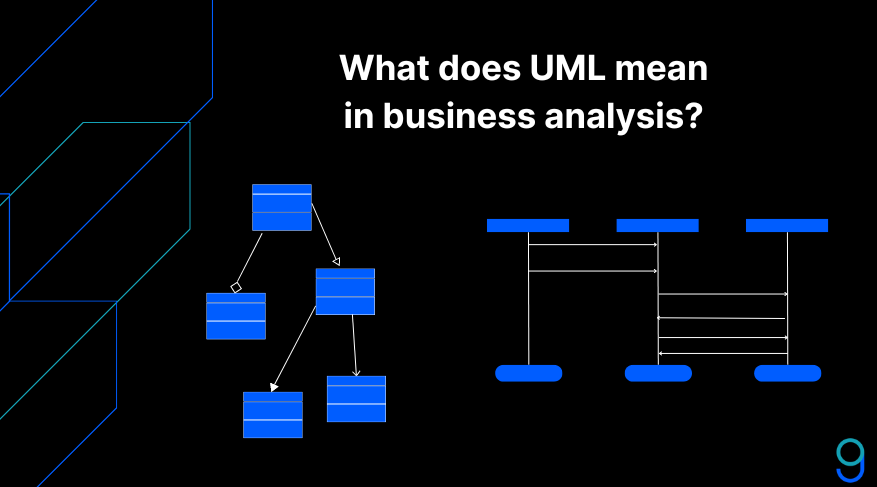
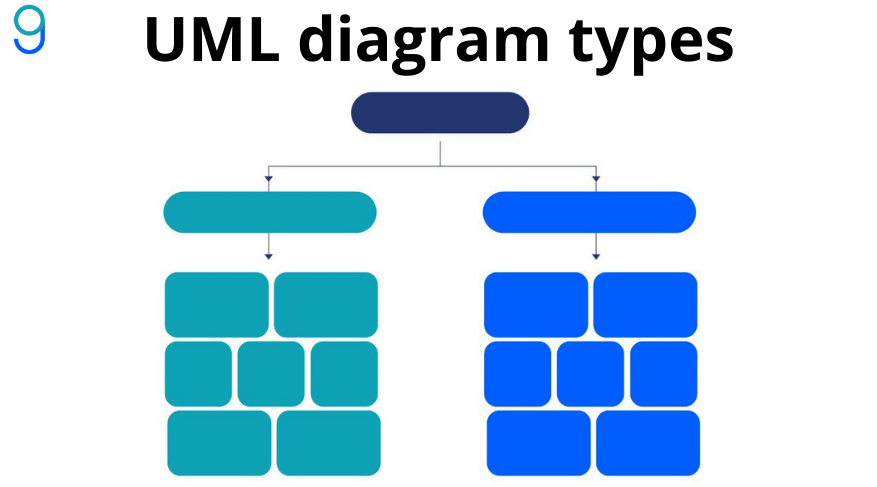
The UML comprises several core components that facilitate the accurate modeling of system architecture. These components, primarily in the form of diagrams, offer diverse perspectives on the system being designed or analyzed. Understanding these diagrams and their specific applications is important for effectively utilizing UML in both software development and business analysis.
greg
16 May 2024
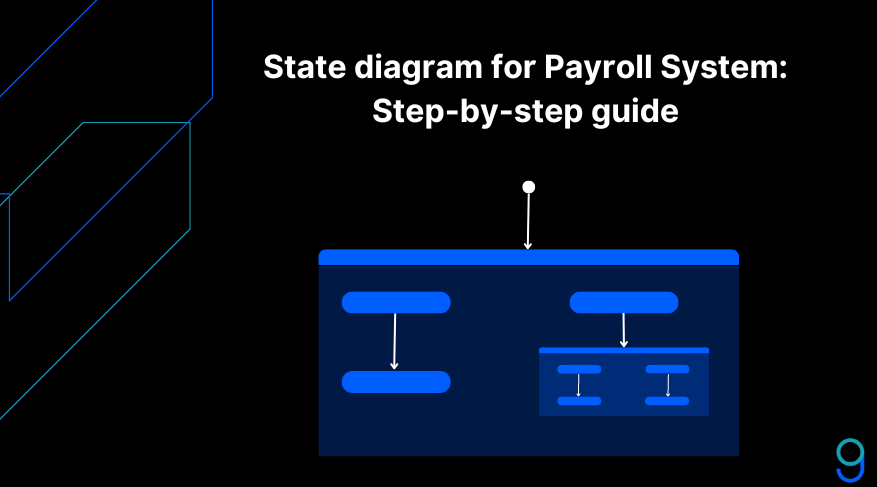
Grasping the intricacies of a payroll system through a state diagram can significantly improve your ability to manage, modify, and communicate the system's functionalities - whether you are a software developer, system analyst, or HR professional. By the end of this article, you will have a clear understanding of what a state diagram is, its key components, what specifics you need to consider for a payroll system,
Constantine Nalimov
29 April 2024
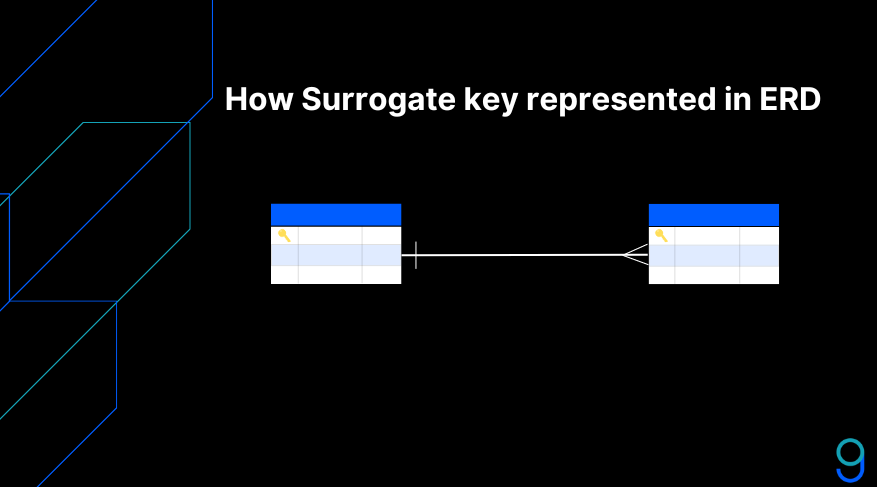
Surrogate keys are artificial identifiers, typically numeric or alphanumeric, used as primary keys in database tables. Unlike natural keys that derive from existing data and may change over time, surrogate keys have no intrinsic meaning to the data itself but offer a stable, immutable identifier for records.
Constantine Nalimov
26 April 2024

A one-to-one (1:1) relationship in ERDs is a fundamental concept that defines how each entity within a database is uniquely associated with another entity. This type of relationship ensures that for every entry or instance of one entity, there is precisely one corresponding entry or instance in another entity, and vice versa.
Constantine Nalimov
23 April 2024

Implementing one-to-many relationships in a relational database is a foundational task that requires understanding both theoretical concepts and practical applications. Below, we outline the basic steps and considerations involved in establishing these relationships effectively.
Constantine Nalimov
16 April 2024
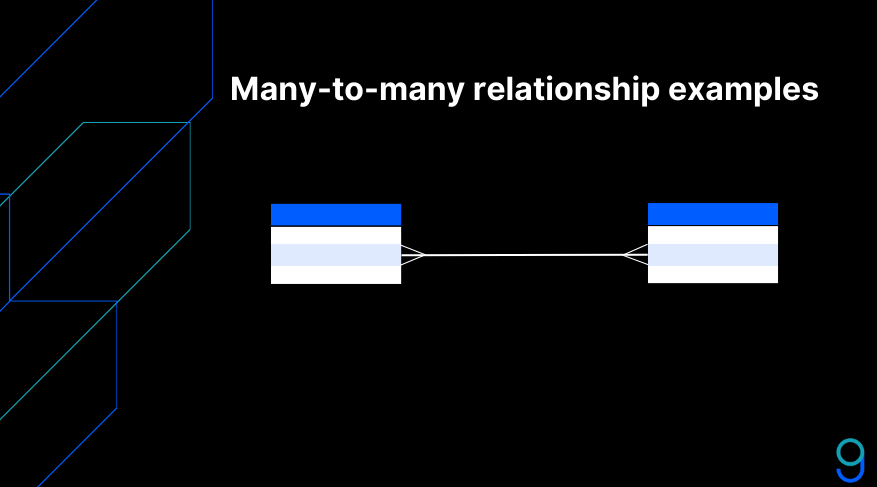
This type of relationship, characterized by the interconnection where several records in one table relate to several in another, forms the backbone of complex database systems, enabling many real-world applications. From social networks connecting users and groups to e-commerce platforms linking customers and products, understanding many-to-many relationships is essential for designing efficient and robust databases.
Constantine Nalimov
16 April 2024
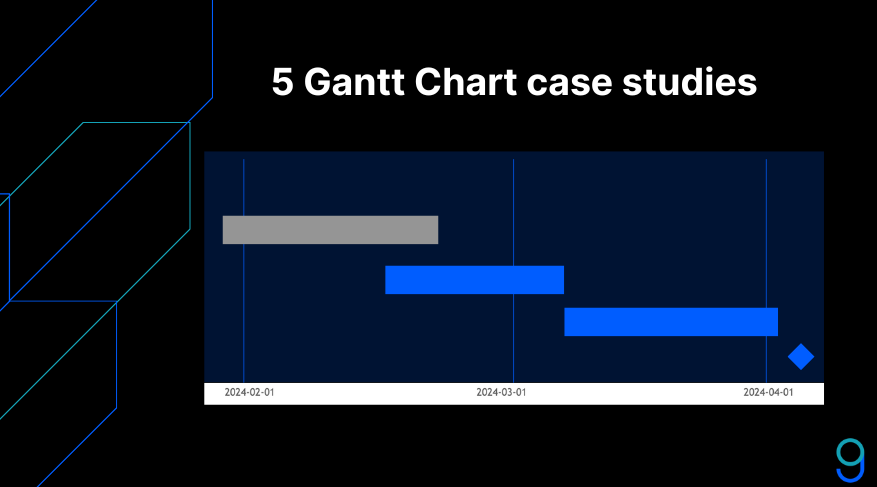
A Gantt chart is a visual representation of a project schedule, displaying the start and end dates of different tasks within a project. It is a powerful tool that offers a clear snapshot of the project timeline, allowing project managers to plan, coordinate, and track specific tasks efficiently. Let's explore 5 practical examples of Gantt charts across various sectors.
greg
15 March 2024
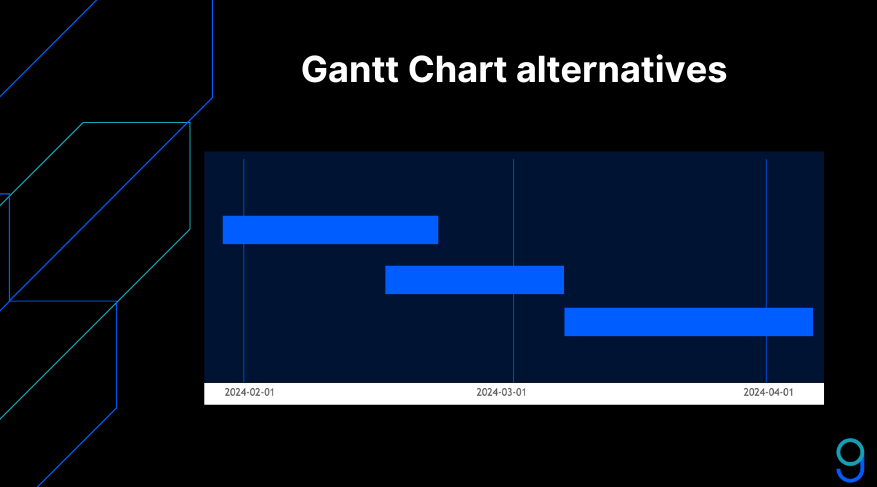
While Gantt charts excel in presenting a static overview of the project timeline, they often fall short in accommodating the dynamic nature of modern projects. These projects require not just a plan, but an adaptable and interactive approach to manage changes, unexpected challenges, and real-time collaboration among stakeholders.
greg
14 March 2024
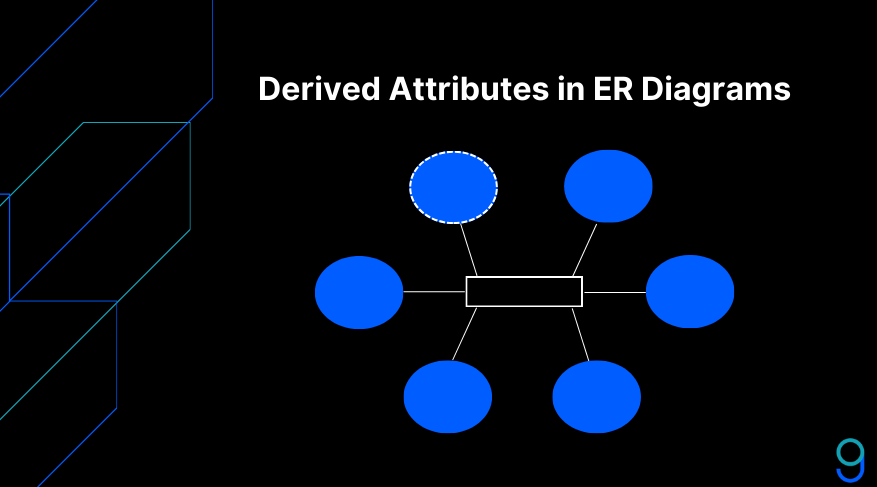
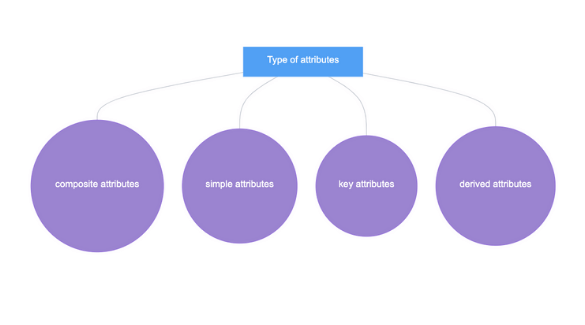
Derived attributes are a class of attributes in ER diagrams that aren't stored directly within the entity; instead, they are computed or derived from other base attributes. These derived attributes do not contain their own data; rather, their values are calculated from existing data within the database.
Constantine Nalimov
13 March 2024
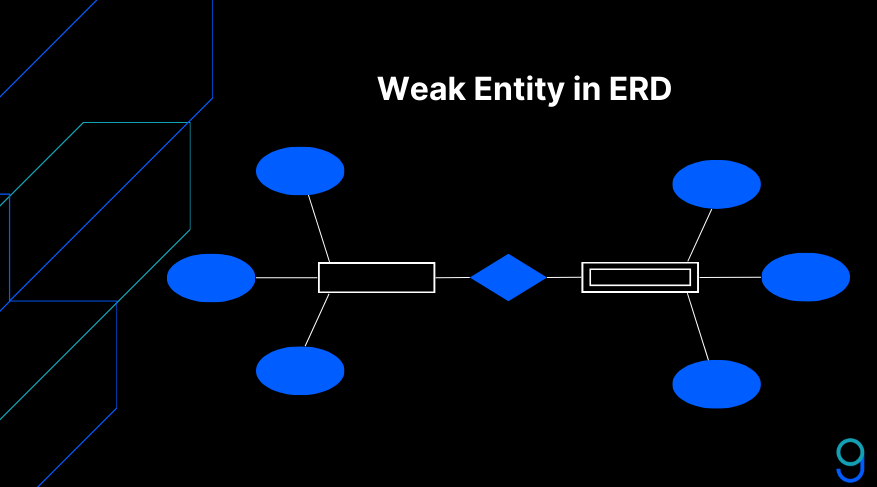
Distinguishing between weak and strong entities, along with practical guidance for their depiction, provides us with the insights needed to improve our database designs. By focusing on common pitfalls and best practices, especially through the use of the Gleek app, we underline the necessity of precision and clarity in our diagrams.
Constantine Nalimov
12 March 2024
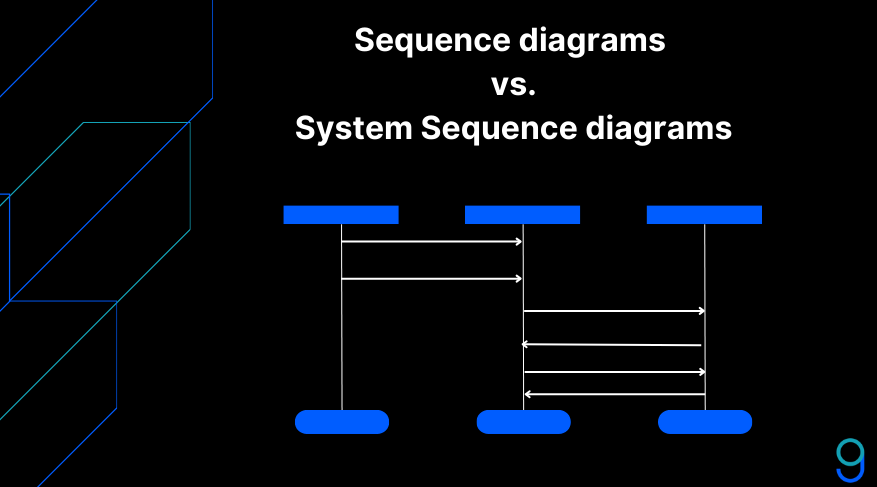
The choice between sequence diagrams and system sequence diagrams hinges on the project phase and specific needs—initial clarity with SSDs versus detailed interaction analysis with Sequence Diagrams. Utilizing both effectively ensures a comprehensive approach to modeling system behaviors and interactions.
greg
11 March 2024
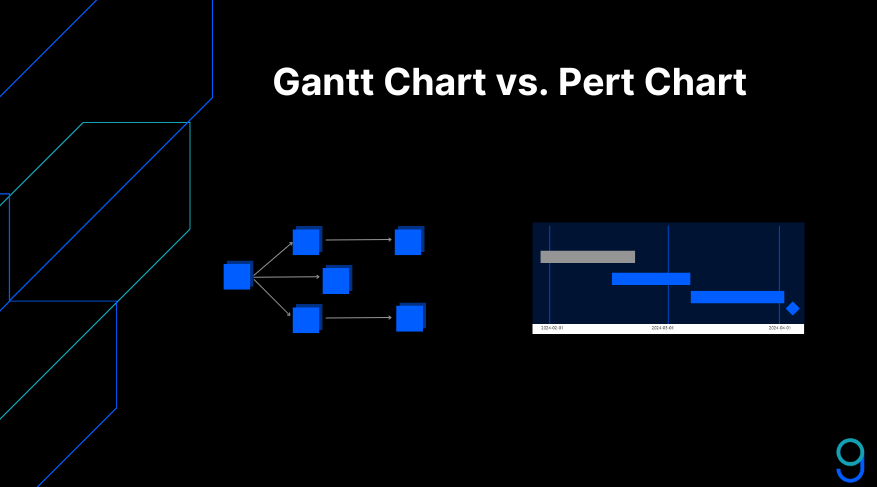
Among the multitude of project management tools available today, Pert and Gantt charts stand out as two of the most popular and widely used. In this guide, we will explore Pert and Gantt charts' use cases and the scenarios in which they excel. We'll also introduce Gleek, a powerful tool for creating Gantt charts.
greg
08 January 2024
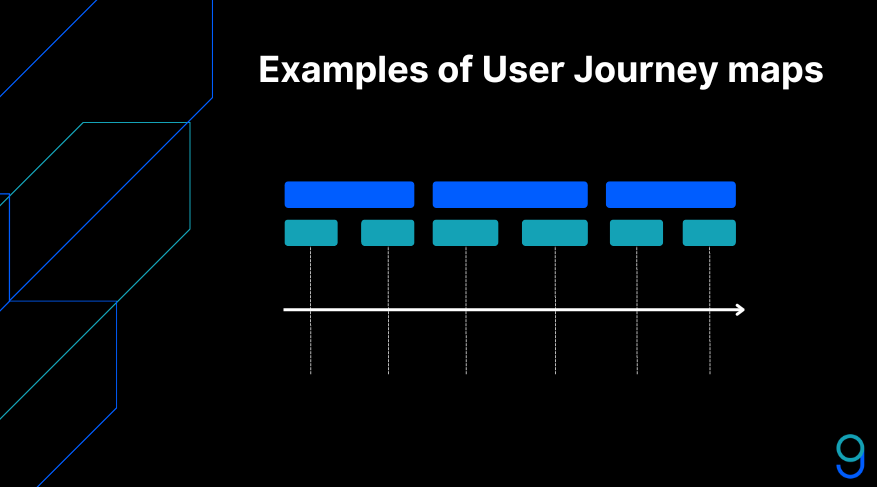
This guide explores User Journey Mapping, uncovering its significance across various industries like e-commerce, SaaS, and mobile apps. It showcases Gleek, a powerful tool simplifying the creation of user journey diagrams, highlighting their role in enhancing user experiences and optimizing business strategies.
greg
05 January 2024
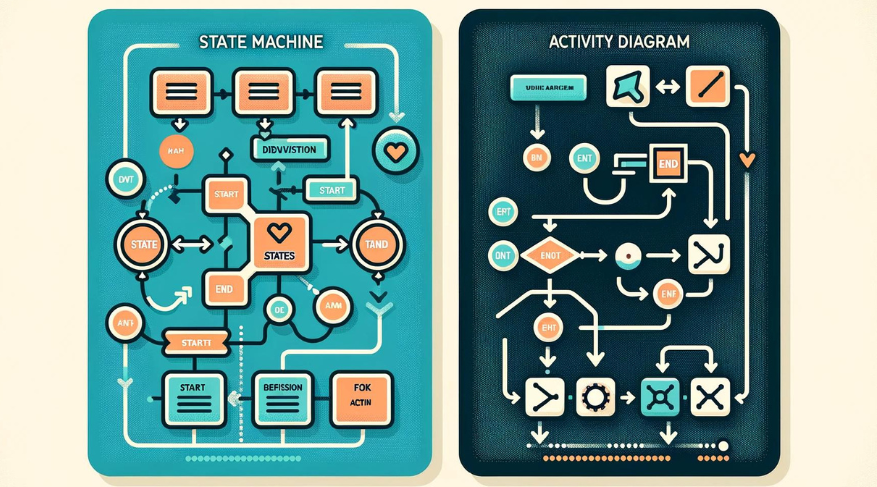
Both state machines and activity diagrams are important for software engineering. State machines help manage complex conditions or track numerous variables, while activity diagrams allow developers and stakeholders to visualize how tasks are interconnected.
greg
03 January 2024
In design thinking, user journey mapping plays an important role. Design thinking itself is a human-centric approach to problem-solving. It involves empathizing with users, defining their problems, ideating solutions, prototyping, and testing.
greg
29 December 2023
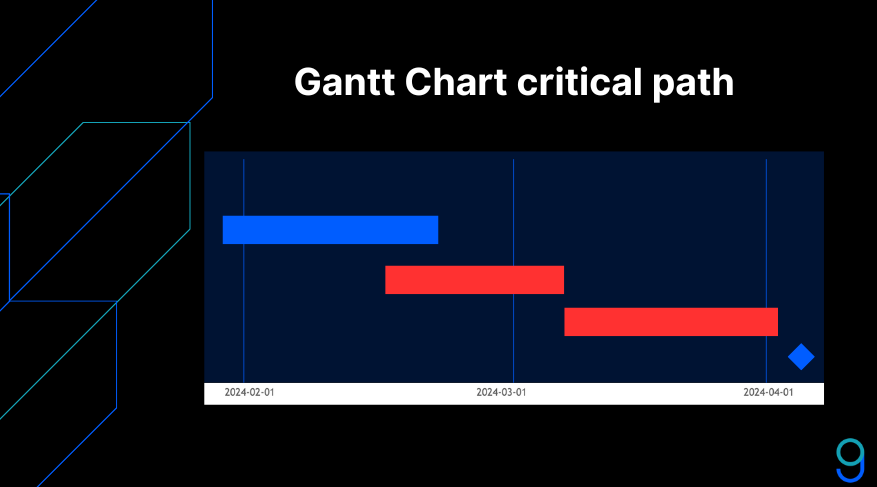
The visual representation of the tasks becomes even more powerful when highlighting the critical path - the sequence of tasks that directly impact the project's completion time. For instance, in a construction project, the critical path might involve foundation laying, structural framing, and final inspection.
greg
28 December 2023
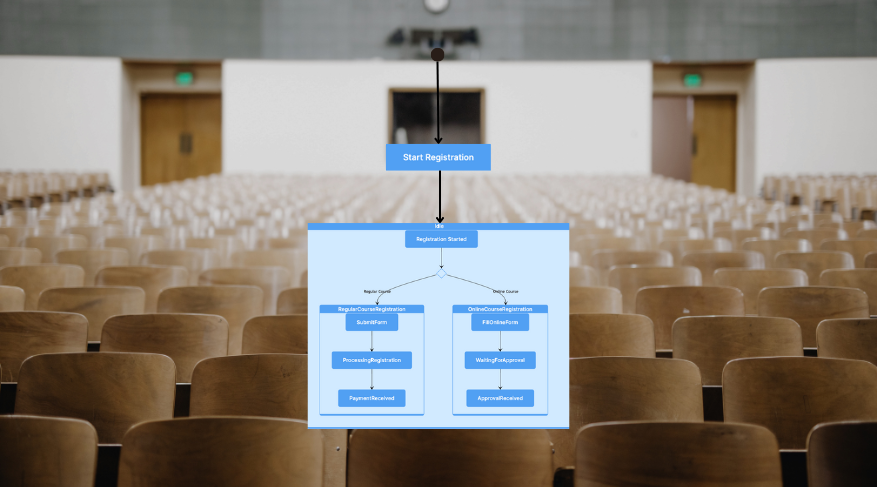
This student registration process diagram aids in visualizing the entire process, from initiation to completion. It efficiently represents the various states a student goes through, the decisions they need to make, and the concurrent paths available to them during their registration journey.
Constantine Nalimov
28 December 2023

User Journey for Food ordering app shows the whole deal of ordering food, from finding the app to browsing the menu, picking stuff, looking over the cart, and hitting that "buy" button. This map traces how users smoothly move from discovering the app to finishing their order, making sure they have an easy time ordering food.
Constantine Nalimov
23 December 2023
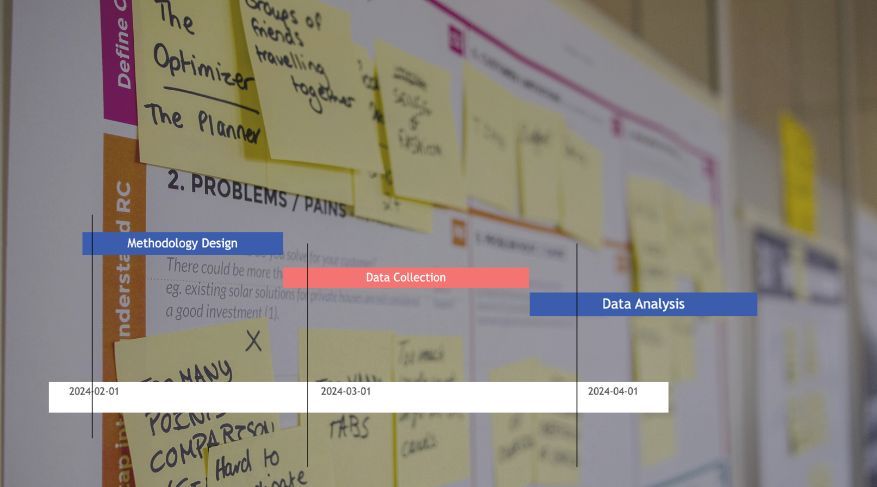
Gantt charts are incredibly useful for planning and scheduling projects, tracking progress, and managing dependencies between tasks. They provide a clear visualization of the project timeline and help to identify potential bottlenecks and overlaps.
Constantine Nalimov
22 December 2023

Understanding the relationship between different aspects of an e-commerce website can be difficult without a visual aid. That's where Gleek, an AI-powered diagramming tool, comes in handy. In this article, we will guide you through the process of creating an Entity-Relationship (ER) diagram for an e-commerce website using Gleek.
Constantine Nalimov
25 October 2023

In a sequence diagram for microservices, you'd illustrate the interactions and messages exchanged between these actors, showing how requests are made, processed, and responses are returned. You may also depict asynchronous communication through message queues or event buses when necessary. The key idea is to visualize how these actors work together to provide the application's functionality while maintaining modularity and scalability, which are fundamental principles of microservices architecture.
Constantine Nalimov
23 October 2023

A University Management System, also known as a Student Information System, is a tool designed to manage all the administrative tasks of a university. It involves managing information about students, professors, staff, courses, assignments, grades, and other educational or administrative data.
Constantine Nalimov
03 October 2023
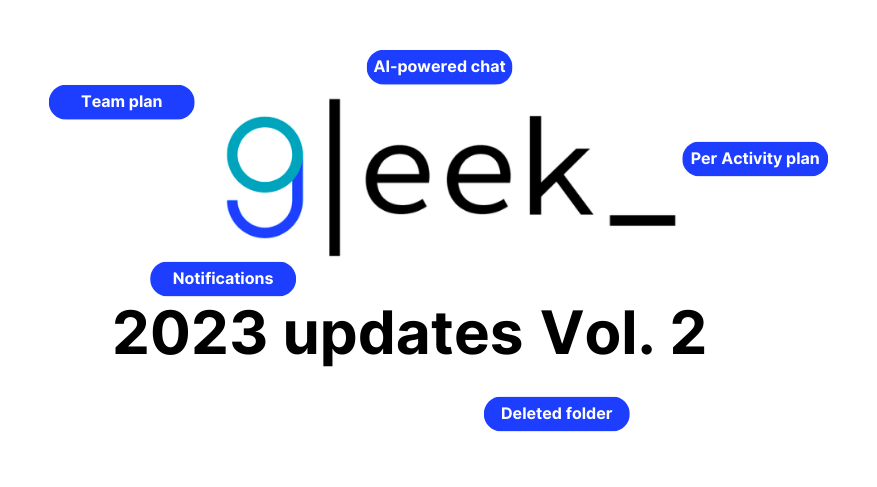
Gleek Features Release Vol. 2 introduces a set of innovative and user-oriented enhancements designed to maximize your diagramming experience. Whether it's leveraging the power of AI in our latest feature, the AI Chat, enjoying the flexible billing of the Per Activity plan, enhancing team collaboration through the Team Plan, staying informed with the timely Notifications feature, or securing your data with the Deleted Folder, Gleek continues its commitment to redefine the diagramming landscape with efficiency, clarity, and precision.
greg
29 August 2023
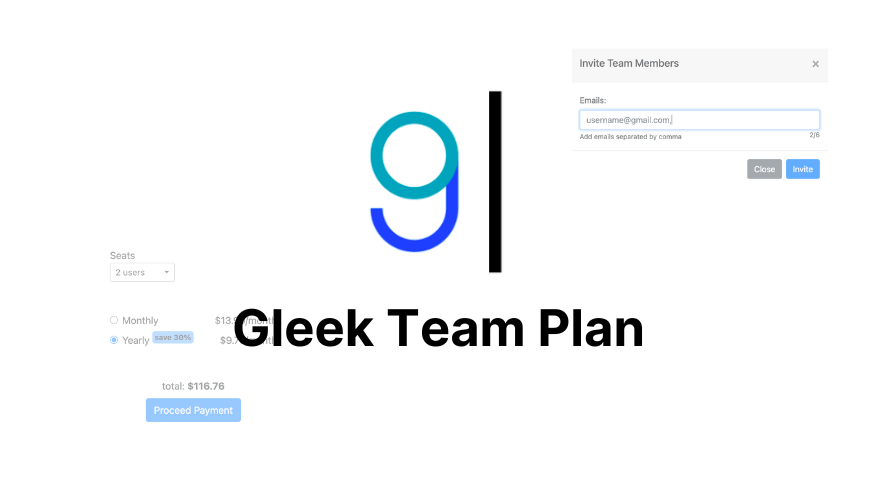
The Gleek Team Plan has been designed with the needs of teams in mind. It's perfect for any group of 2 or more users who want to collaborate effectively using Gleek and share their outputs. Whether you're a software development team working on a complex project or a group of students brainstorming for a class assignment, the Gleek Team Plan provides you with the tools you need for enhanced productivity.
greg
29 August 2023
The Per Activity plan offers a high degree of flexibility and cost-effectiveness, making it an ideal choice for users with variable diagramming needs. Unlike the Standard Premium Plan, you're only billed based on your activity, ensuring you only pay for what you use. If there are months where you don't require Gleek's services, you won't be charged, providing significant savings.
greg
29 August 2023
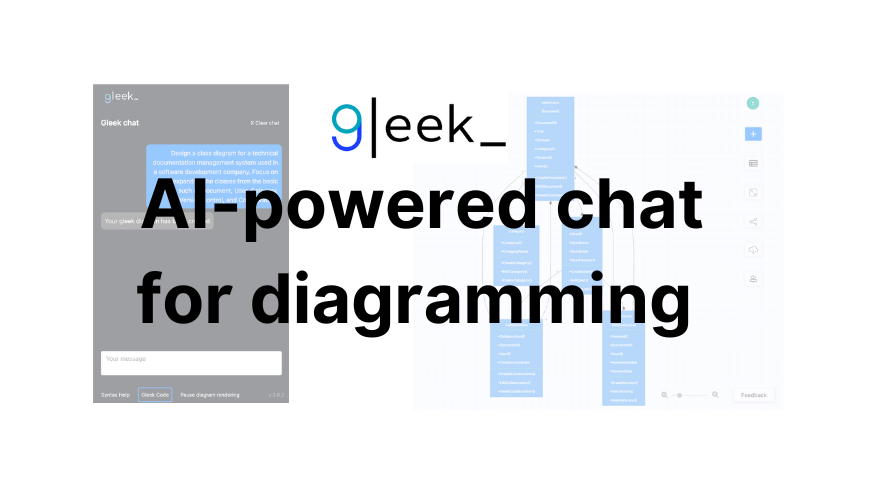
In the first installment of our AI Chat series, we introduced Gleek's new AI Chat feature and its potential to redefine your diagramming experience. As we continue our exploration in this second part, we will look into the mechanics of Gleek's AI Chat and demonstrate its application through two case studies.
greg
29 August 2023
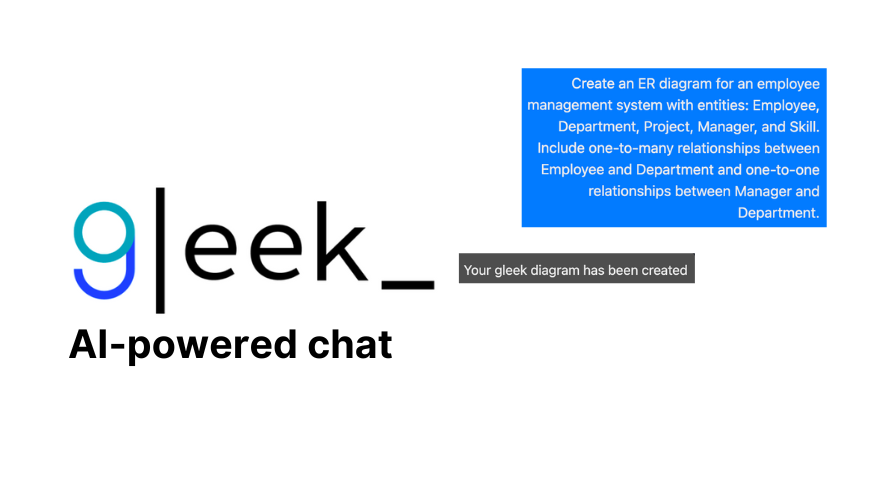
As Gleek continued to evolve, we saw an opportunity for further innovation. We asked ourselves, "What if we could make the process of creating diagrams even easier? What if we could transform prompts into ready-to-use diagrams?" And thus, the idea for Gleek's AI Chat was born.
greg
29 August 2023
We are excited to announce some of the latest updates to Gleek that will help you create high-quality diagrams more efficiently. Let's take a closer look at the new features we have added.
greg
22 May 2023

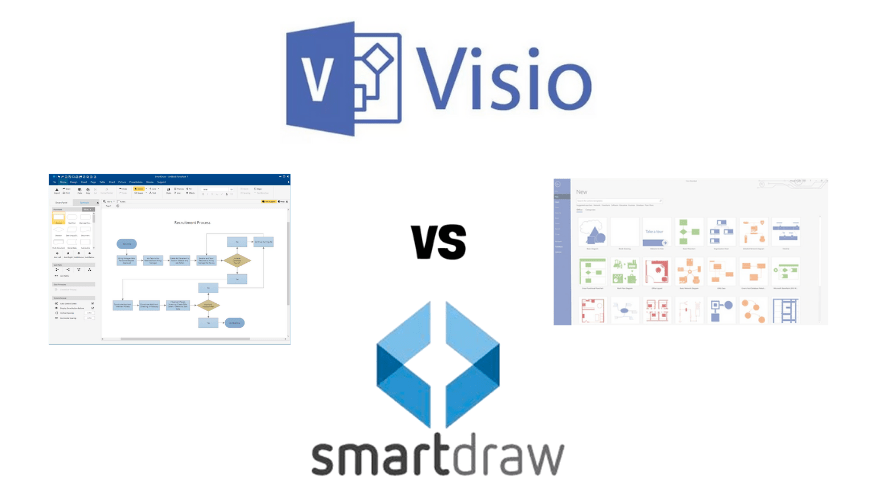
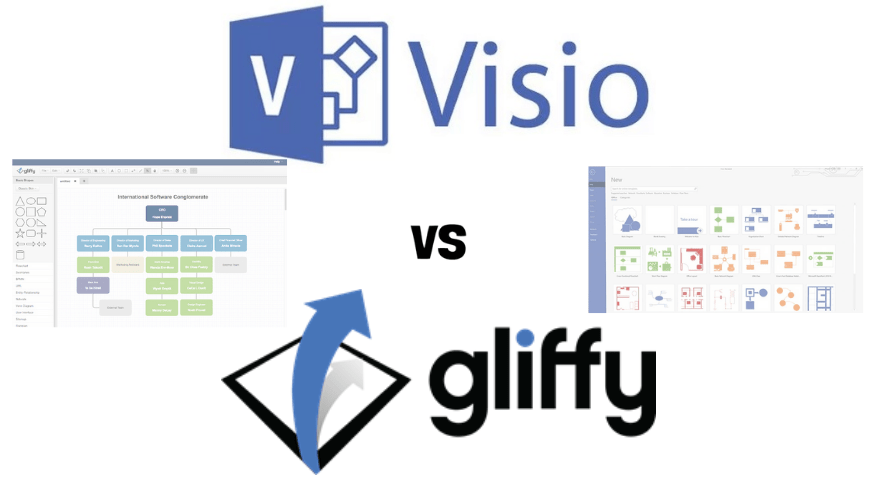
Visio is an expensive diagramming solution, but there are plenty of other options available at no cost. In this article, we will explore 8 Visio alternatives that offer similar features without breaking your budget. From open-source solutions to cloud-based applications, these Visio replacements have something for everyone.
greg
22 March 2023

In general terms, an online shopping system is a platform on which you can buy products online. Consequently, there are two parties — sellers and buyers — as well as the object of sale, i.e., product (or items). It is also worth bearing in mind that the product is bought and sold for money, which leads to...
Constantine Nalimov
17 November 2022
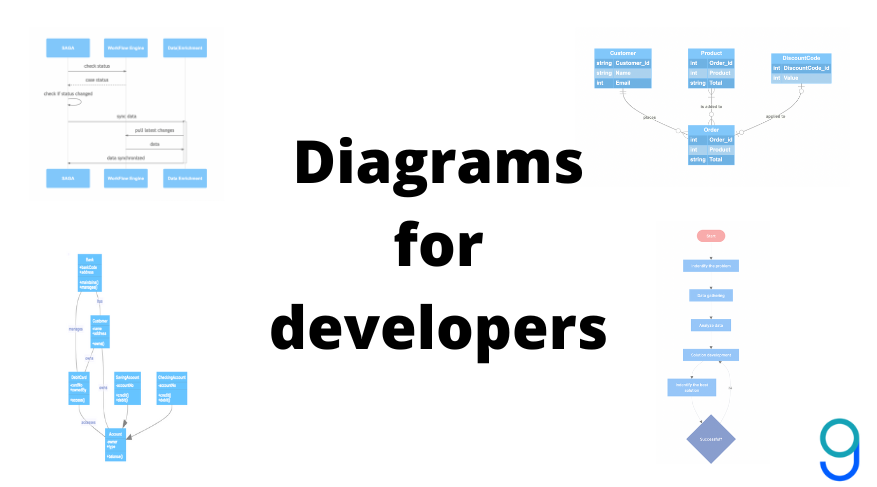
Software development is a tricky business that needs a lot of planning. What’s the best way to plan massive databases and map their relations? Diagrams, of course! But what kinds of diagrams are the most useful for software developers? The common diagram types we all know, like Venn and mind maps, may be useful for other professions and ideas, but not so much for software. The best diagram types for developers are...
greg
06 October 2022
In relational tables within a database, there are several types of ‘keys’. Keys are used as identifiers for the information in the table, as well as defining the relationships between tables. Let’s take a closer look at two of these identifiers: primary keys and foreign keys. What is a primary key? Primary keys are columns…
Nika
12 May 2022
In relational database tables, we use ‘keys’ to identify and find information more easily, or to show the relationships between the data of two different tables. Two of these identifiers are primary keys, and unique keys. Let’s take a closer look. What is a primary key? Primary keys are a column or set of columns…
Constantine Nalimov
04 April 2022
We’ve talked about Lucidchart plenty of times in the past, but how does it stack up against Miro? Lucidchart and Miro are two amazing diagramming tools used by software developers for plotting out databases. These services aren’t just for developers though, people from all industries can benefit from a well made diagram. Lucidchart vs. Miro…
greg
15 March 2022
What is the ER Model? ER model, short for entity-relationship model, is a diagram type that shows real world objects, their characteristics, and the relationships they have with one another. ER diagrams are used as blueprints for developers when creating databases. ER diagrams provide a visualized model that is easy to read and understand.
Constantine Nalimov
28 February 2022
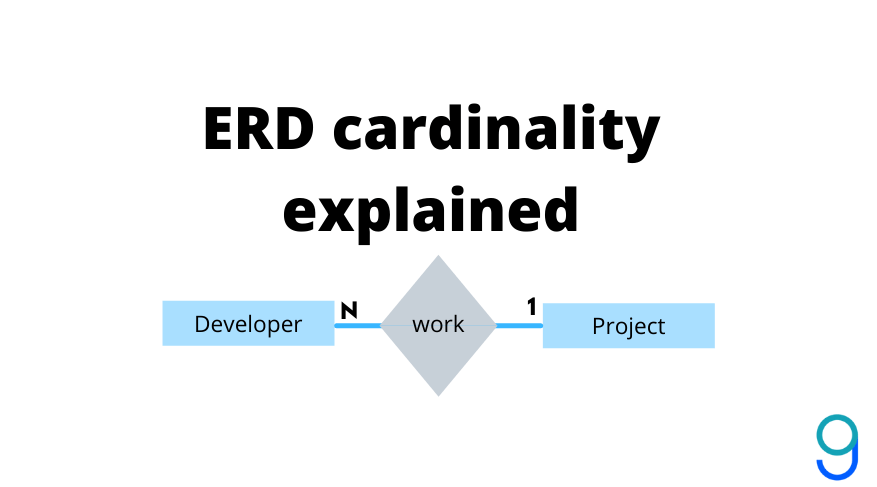
There are a lot of things to learn about ER diagrams before you can read and understand them. Things like entities, attributes, symbols and notations are all important to know about, including how they are represented, before trying to make sense of an ER diagram. Another important aspect of ER diagrams is cardinality and relationships.…
Constantine Nalimov
03 February 2022

In the world of diagramming tools, Lucidchart is one of the best and most well known programs on the market today. However, you may find Lucidchart to be lacking in some ways, or maybe you just want to try something new. There are a lot of excellent alternatives out there, and here are some of…
greg
13 January 2022
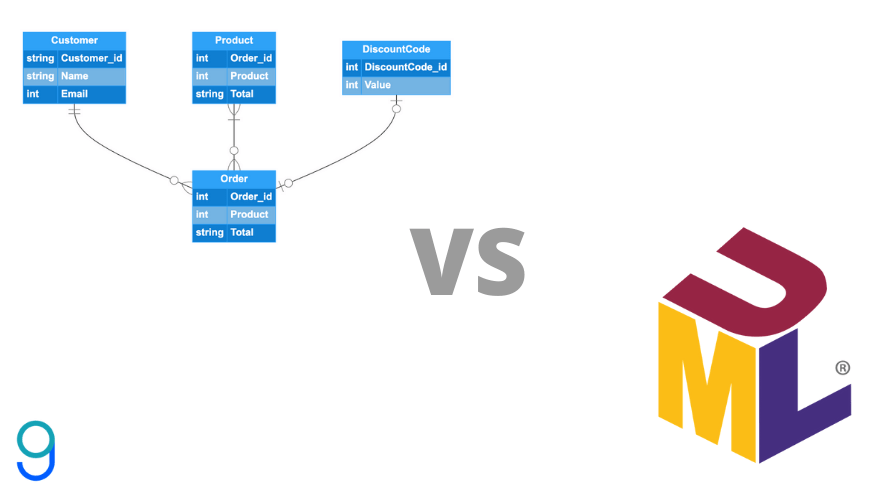
UML and ERDs are both used by software developers to map out software systems and databases before any actual coding occurs. Making a diagram beforehand helps developers see what components are needed, and how the system or database will be structured. UML is a series of symbols and shapes that help to visualize how software…
greg
20 December 2021
Smartdraw is a diagramming tool for individuals, small businesses, and enterprises that was created by Smartdraw Software in 1994. With this tool, users can create flowcharts, organizational charts, floorplans, and more. No matter how large or small your team is...
greg
17 December 2021
Hi Gleek.io fans! Welcome to our roundup of the huge number of improvements that have been added to Gleek in the last year. Gleek version 3 is a huge step forward and we’re proud to say that we’ve achieved everything on our roadmap for 2021. We also listened to your valuable feedback and implemented some…
greg
09 December 2021

What is an ER diagram and what can it be used for? Entity-relationship diagrams show how data objects relate to each other in a database. With just three basic elements – entities, attributes, and relationships – a database designer can use an ER diagram to sketch out the structure of the system. An ER diagram…
Constantine Nalimov
03 December 2021

What are entity-relationship diagrams? An ER diagram is a way for the designer of a database to visually represent the entities, or data objects, to be created in the system. The ERD is drawn before starting work on creating the database itself, so that the designer can identify potential problems and clarify business requirements. Or…
Constantine Nalimov
29 November 2021
There aren’t many things in this world that can’t be captured with a good flowchart. Flowcharts are diagrams used for showing the steps of virtually any process; from the clear and linear, to processes with a dozen variables and decisions. In the technology sector, they’re used to show the flow of algorithms, system processes, and…
greg
23 November 2021

What is a sequence diagram? Sequence diagrams are a type of Universal Modeling Language (UML) diagram. They’re used to show how objects in a system work together over time. A sequence diagram helps the designer of a system visualize and understand the order in which these interactions occur. This can make it easier to identify…
Constantine Nalimov
18 November 2021
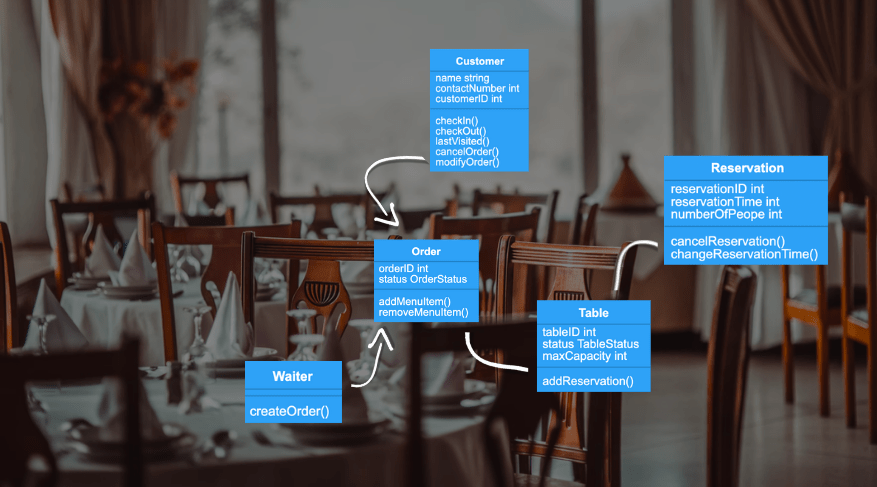
What are class diagrams and what are they used for? Class diagrams are an amazingly versatile type of UML diagram. They can be used in all kinds of software development to rapidly sketch out an informal diagram of how a system should be built. Because class diagrams are easy to understand, they can be shared…
Constantine Nalimov
10 November 2021
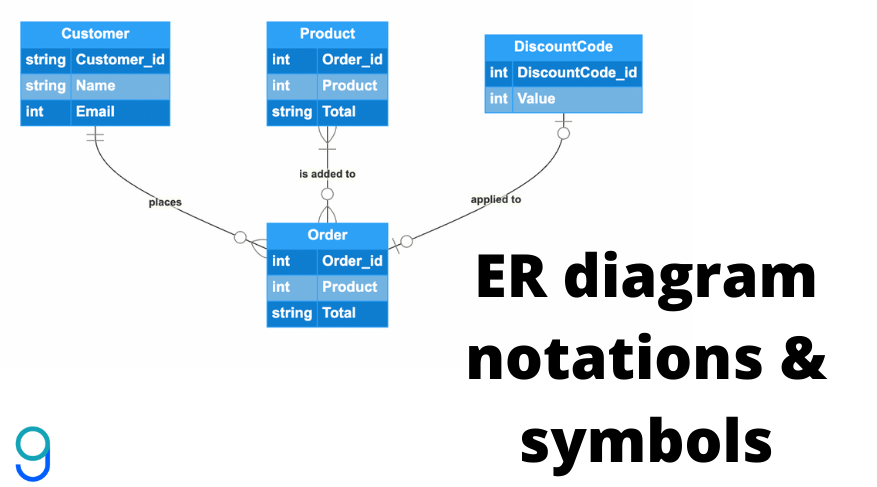
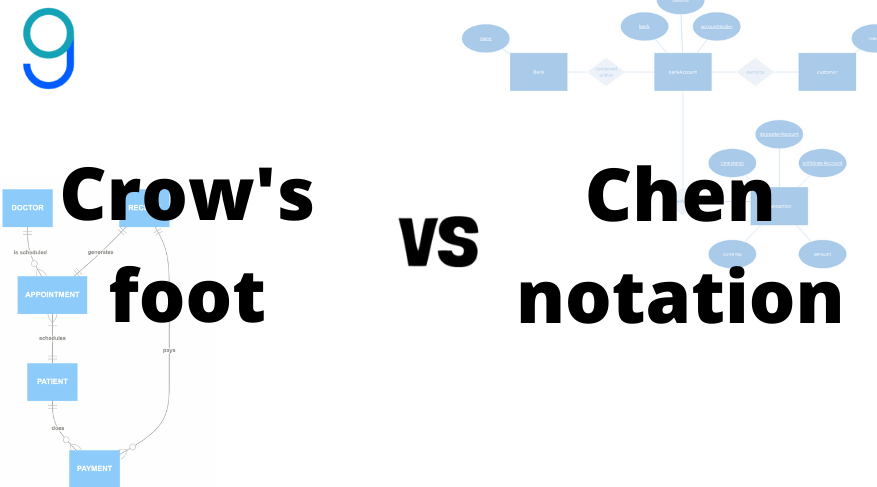
Entity-relationship diagrams, also called ERDs or ER diagrams, are flowchart-like diagrams that explain the structure of entities, attributes, and their relationships in a database. They are mainly used for relational database design, and can be used to troubleshooting designs. There are many notations and symbols that are unique to ERDs that you need to know…
greg
02 November 2021
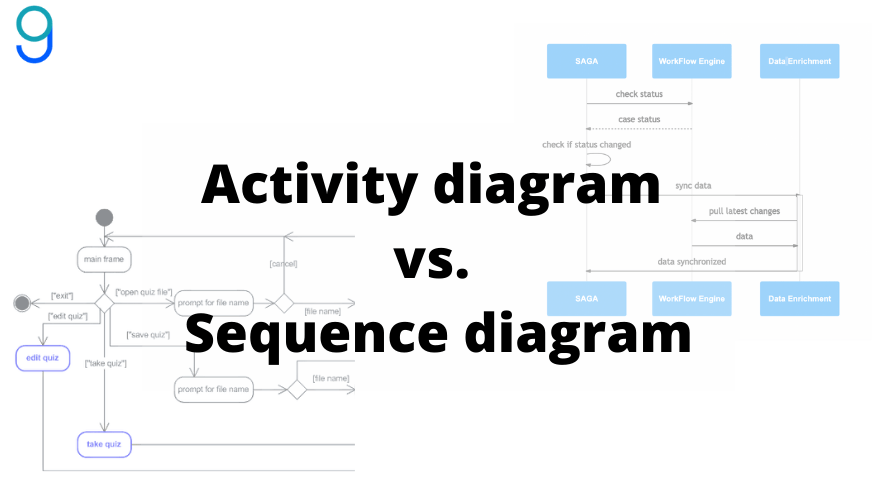
Both activity diagrams and sequence diagrams are used by software developers to show actions and relationships within a software system. But, before we get into these two diagram types, we first need to talk about UML. Universal Modeling Language, also known as UML, is a standardized language used in software diagrams to represent the items,…
Constantine Nalimov
27 October 2021

What is the purpose of sequence diagrams? Sequence diagrams are one of the 14 different types of Unified Modeling Language (UML) diagrams. While some of these diagrams, such as class diagrams or object diagrams, are designed to show the static structure of a system, a sequence diagram shows how the system behaves over time and…
Constantine Nalimov
19 October 2021
What is a class diagram and what is it used for? Class diagrams are one of the most popular Unified Modeling Language diagrams. For over 20 years, the UML standard has provided software engineers with a standardized way to visualize and diagram systems before starting to code. Class diagrams are great for sketching a static…
Constantine Nalimov
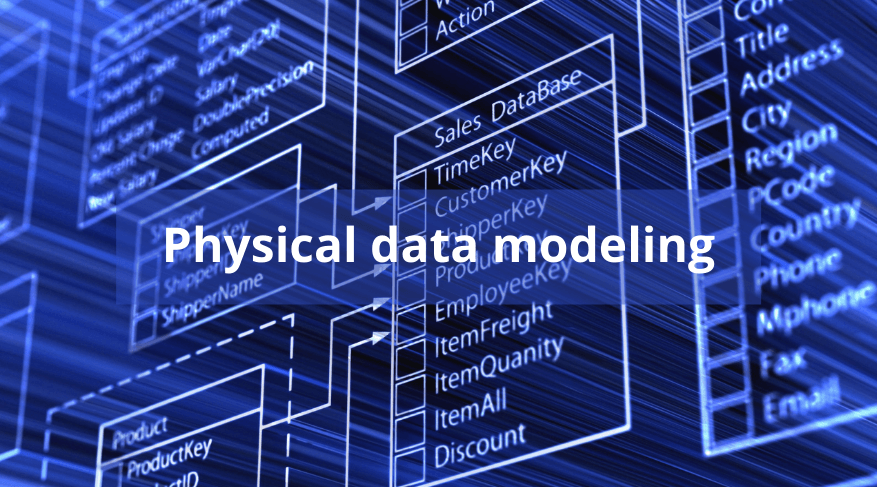
12 October 2021
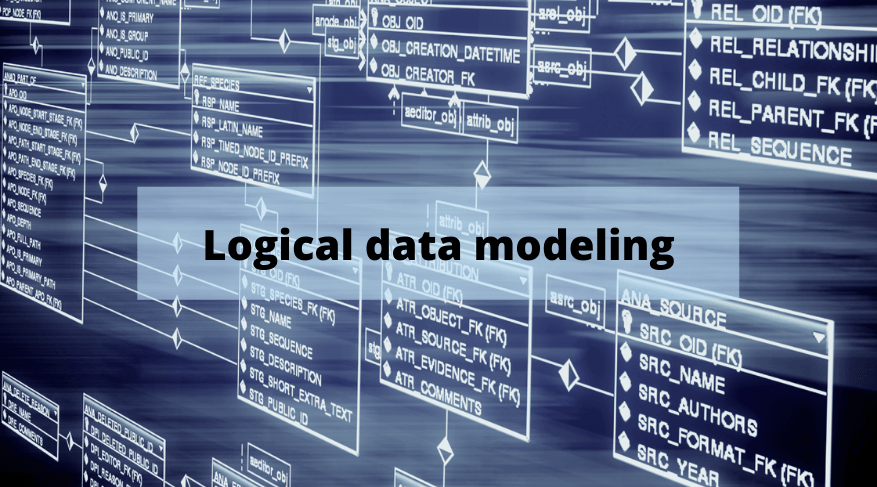
What is the purpose of a logical data model? The first stage in designing a database is the conceptual model and the last is the physical model. In between sits the logical model. In a logical data model, the database designer or database architect moves on from the big picture of the conceptual model and…
Constantine Nalimov
01 October 2021
What is data modeling? When starting to create a new database, the database designer or database administrator needs to carefully plan ahead. Mistakes made in the planning phase could be very costly later on when the database is in the process of being put together and decisions have already been made on what kinds of…
Constantine Nalimov
22 September 2021

So, maybe you’re a budding entrepreneur, looking to create a product for the first time. Or perhaps your business struggles with launching new products because of disorganization. Whatever your situation is, everyone can benefit from using the new product development process. What is the new product development process? The new product development (NPD) process is…
greg
14 September 2021
One of the best things about today’s world is the abundance of choices we have when shopping. But as we all know, the endless options can also be a curse. How do you know you’ve made the right choice? What if there’s something better out there? This is true across every facet of life, including…
greg
03 September 2021
What is an entity-relationship diagram and what is it for? An entity-relationship (ER) diagram, ERD, or entity-relationship model, is commonly used in the early stages of designing a database. An ERD is perfect for quickly sketching out the elements needed in the system and explaining how they interact. ER diagrams can be shared with colleagues…
Constantine Nalimov
19 August 2021
What are sequence diagrams and what are they used for? Sequence diagrams are one of the 14 diagram types that can be created using the Unified Modeling Language (UML). UML diagrams are generally used when designing software and databases to make sure that the system will work as required and to reveal potential problems before…
Constantine Nalimov
10 August 2021
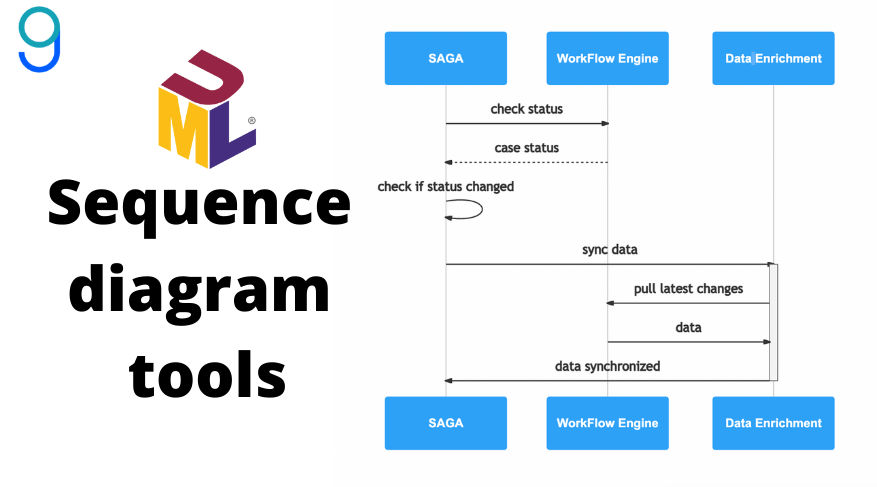
Let’s talk sequence diagram tools. What are they? What can you use them for? Which one is best for you and your team? We’ve compiled a list of the top 8 UML sequence diagram tools on the market in 2021, and can hopefully answer some of these questions for you. Sequence diagrams are just one…
greg
02 August 2021
What is data modeling? Data modeling is an essential first step in the design of any database. The database designer or database administrator creates models to represent the data objects to be stored, their attributes, and the relationships between them. The diagrams or documents created act as blueprints for the final result and keeps the…
Constantine Nalimov
29 July 2021

What is data modeling? Data modeling is a way of creating a blueprint, often an actual diagram, for the design of a data storage system. It clearly shows the data types to be stored, how they relate to each other, and the rules that are needed for the system to operate. Check out this Gleek…
Constantine Nalimov
21 July 2021
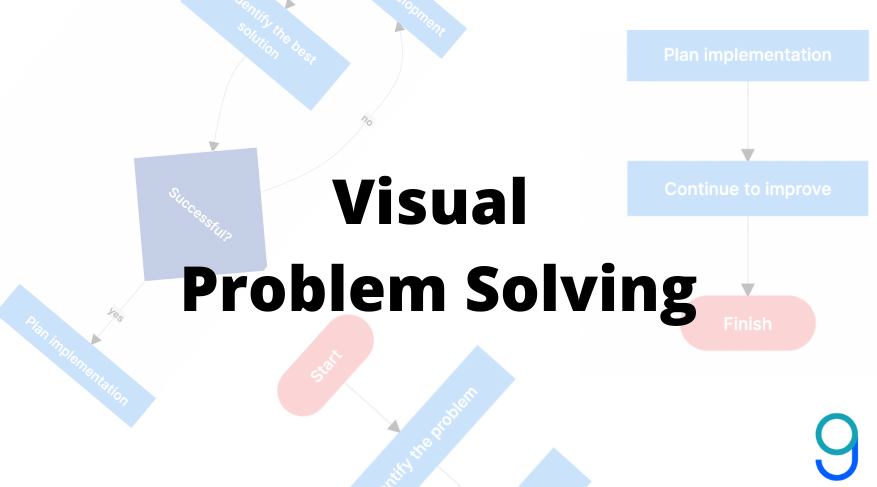
What’s life without problems? Probably a little boring, if we’re being honest. If everything were perfect all the time, there would be no challenges, and things would get pretty monotonous. This is a rather optimistic view on what many believe to be an aggravating part of life. No matter how you feel about problems, one…
greg
12 July 2021
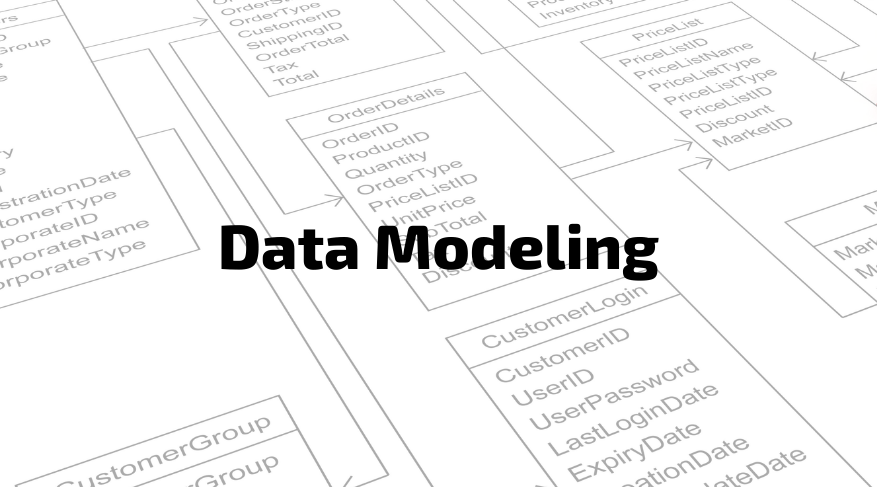
What is data modeling and what is its purpose? Data modeling is a way to visualize a data storage system. The system is represented by a diagram that attempts to explain the data to be stored, the relationships between the different types of data, and the formats, attributes, and rules that make the system work.…
Constantine Nalimov
01 July 2021
Some things are near impossible to explain using words alone. This is especially true in the software world when describing systems, and the relationships between them. How do we solve that problem? With diagrams, of course. Two great tools for creating diagrams across all types of industries are Lucidchart and Draw.io. So, which is the…
greg
24 June 2021
UML, or Unified Modelling Language, is a visual diagramming language used to represent the design of systems or processes. It is especially useful for designing software and databases. Creating a UML diagram before any code is written is an efficient way for programmers to keep track of all the components involved and how they relate…
greg
16 June 2021
What is UML? The Unified Modeling Language (UML) is a general-purpose modeling language used to visualize the design of a system. You can think of UML as a way to create blueprints so that software is fully understood by the designer before any coding begins. Models assist developers by letting them initially work at a…
Constantine Nalimov
07 June 2021
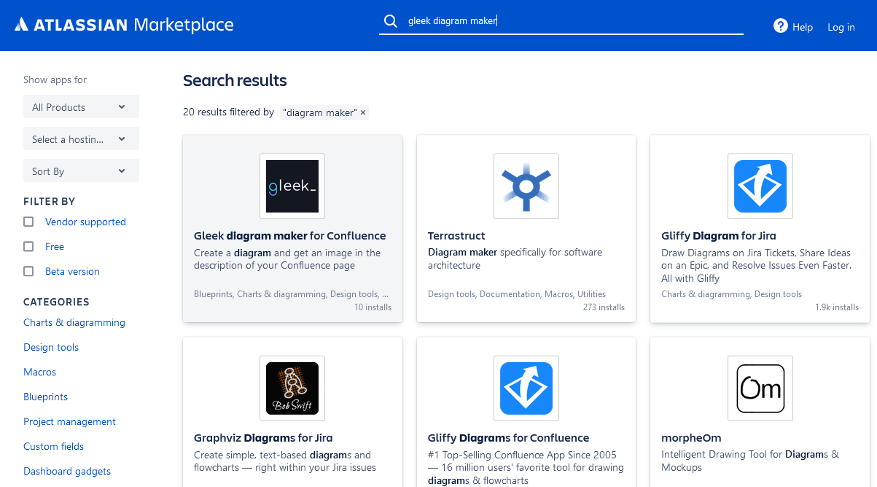
What is Confluence? Confluence is a wiki, or knowledge base, to help teams collaborate and share project assets. Resources such as product requirements, design documents, ideas, meeting notes, calendars, and all relevant information or materials can be stored in Confluence and accessed by everyone involved in the project. All stakeholders can edit, provide feedback and…
greg
28 May 2021
Why use Azure DevOps? At Blocshop we use both our own Gleek diagram maker and Azure DevOps, so it made perfect sense for us to create a Gleek extension for Azure! Azure DevOps is a web-based collaboration tool focused on giving support teams the tools they need to work together effectively on code development, planning, testing,…
greg
21 May 2021
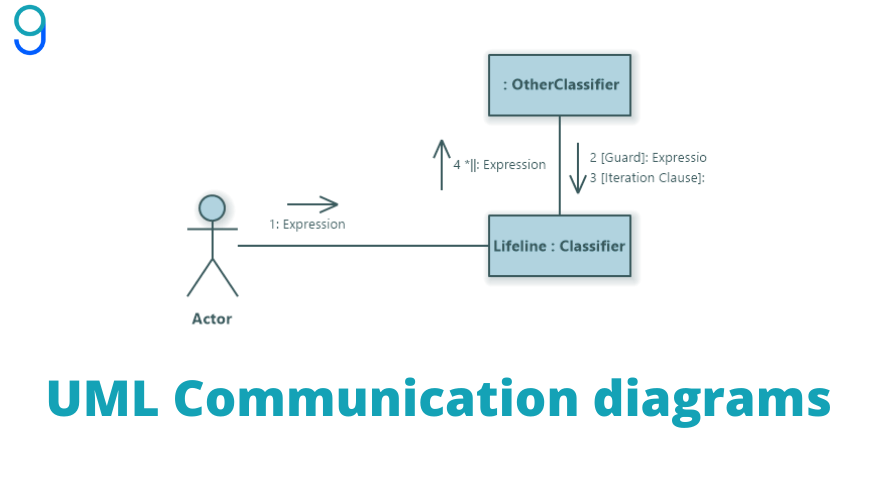
UML diagrams can either be structural, or behavioral. A few behavioral diagram types include activity, communication, and sequence diagrams. UML communication diagrams, formerly known as collaboration diagrams, show the relationships between objects, and how messages flow...
Constantine Nalimov
11 May 2021
Do you often work on large, complicated projects by yourself or with a team? Chances are you’ve heard of LucidChart and Gliffy. Both of these services provide easy-to-use diagramming tools for all types of projects. From flowcharts to mind maps, diagrams are used to organize, collaborate, and track progress on projects or plans. Lucidchart is…
greg
03 May 2021
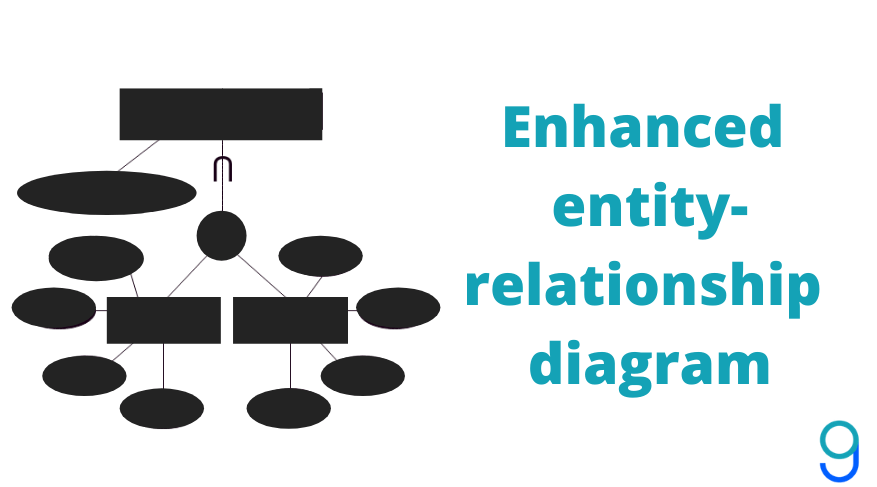
Developers use entity-relationship diagrams to sketch out designs for databases. As their name suggests, enhanced entity-relationship diagrams take ER diagrams a step further and allow for much more complex designs for modern databases. EER diagrams give developers the tools to add...
greg
26 April 2021

What is a sequence diagram and what is it used for? A sequence diagram is a type of UML (Unified Modelling Language) diagram that is used to model interactions between objects in a system over time. The sequence diagram lets a developer sketch out and demonstrates how processes will behave and interact in sequence. The…
Constantine Nalimov
15 April 2021

What is the Confluence tool used for? Atlassian created Confluence workspace to help teams. Atlassian wrote Confluence in Java in 2006 to create a place to organize and boost productivity. According to Atlassian Confluence helps teams: Scale agile practices Consolidate workflows Expand visibility Plan, track, and release In practice, many kinds of teams use Confluence…
greg
02 April 2021

What are the uses for cross-functional flowcharts? We know that software development teams use flowcharts to diagram steps and decisions. Flowcharts show a process, step-by-step. Flowcharts help teams organize and visualize systems. We can use them to document, brainstorm, or record a decision-making process. Most importantly, flowcharts must be easy to read and understand.…
greg
22 March 2021

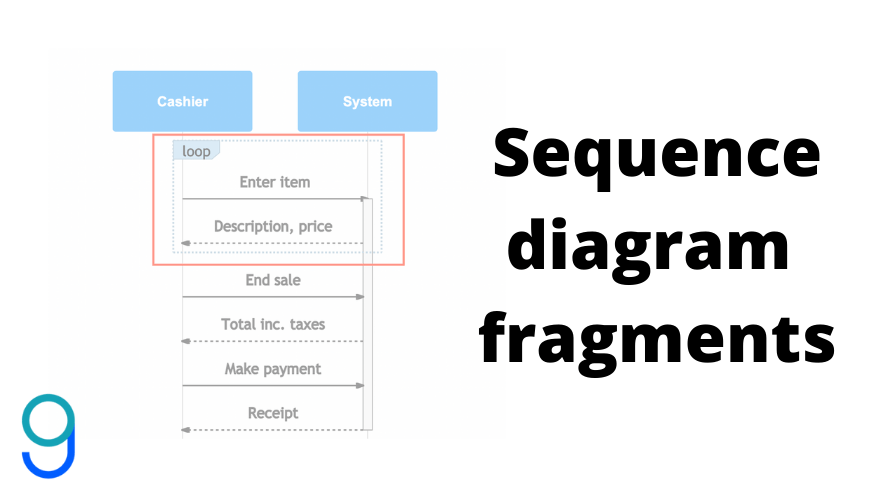
What is a sequence diagram and what is it used for? Sequence diagrams show an overview of the interactions between objects in a system over time. Also called event diagrams or event scenarios, sequence diagrams depict the sequential events that occur and the processes that are completed. Sequence diagrams descend from top to bottom to…
Constantine Nalimov
11 March 2021
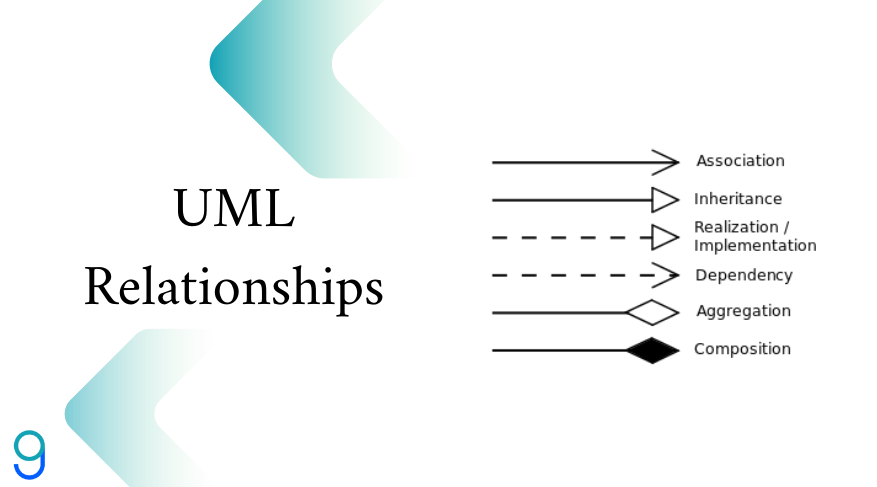
What are class diagram relationships? UML class diagrams allow developers to graphically represent a system or program. UML stands for unified modeling language. UML diagrams map out the classes, attributes, operations, and relationships among objects in a system. Developers use UML class diagrams to view the structure of static systems. What are UML classes exactly?…
greg
02 March 2021
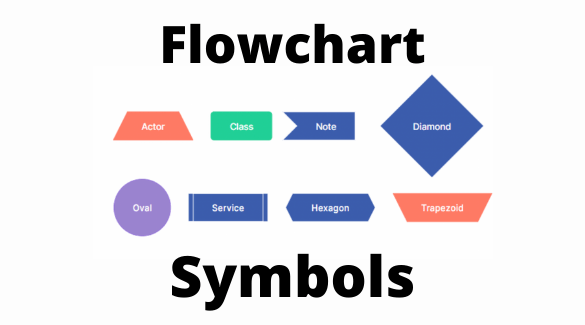
What symbols do we use in flowcharts? A flowchart is a diagram that shows a process, decision, or action in a project. It helps teams organize and visualize systems. We can also use flowcharts to document, brainstorm, or record a decision-making processes. Most importantly, flowcharts must be easy to read and understand.
greg
25 February 2021
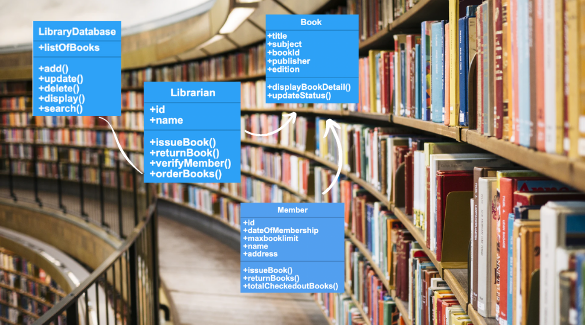
What is a class diagram and what is it used for? Diagramming helps developers and software architects plan and map out projects. But diagramming works well for other fields as well. Today we will take a look at class diagrams. We will define and explain class diagrams. Then we will show how class diagrams can…
Constantine Nalimov
18 February 2021
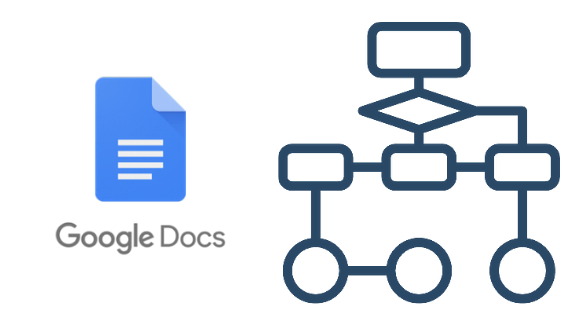
How do I create a flowchart in Google docs? Flowcharts help teams organize and visualize systems. Frank and Lillian Gilbreth created the first flowchart in 1921. They presented the concept of flowcharts to the American Society of Mechanical Engineers in their talk, “Process Charts: First Steps in Finding the One Best Way to do Work.”…
greg
29 January 2021
What is an ER diagram? What do we mean when we talk about ER diagrams? Developers use ER diagrams to outline the design of a database. In times past, a database engineer could diagram database relations on a whiteboard. Nowadays, we need powerful tools to properly map out a database. ER diagrams graphically represent the…
greg
13 January 2021
Software development has become more complicated. UML retains an important place in any software development project. UML gives teams a valuable tool for mapping complex software projects. UML is a flexible, universal visual modeling language. UML creates a standard form to visualize systems.
greg
17 December 2020

So you’ve signed up with Gleek and you want to make some diagrams. But you’re not sure where to start… Don’t worry, here’s our quick start guide to using Gleek. Once you’ve read this, you’ll be happily diagramming like a pro 💪 The simplest thing you can do in Gleek is to make a shape.…
Constantine Nalimov
10 December 2020

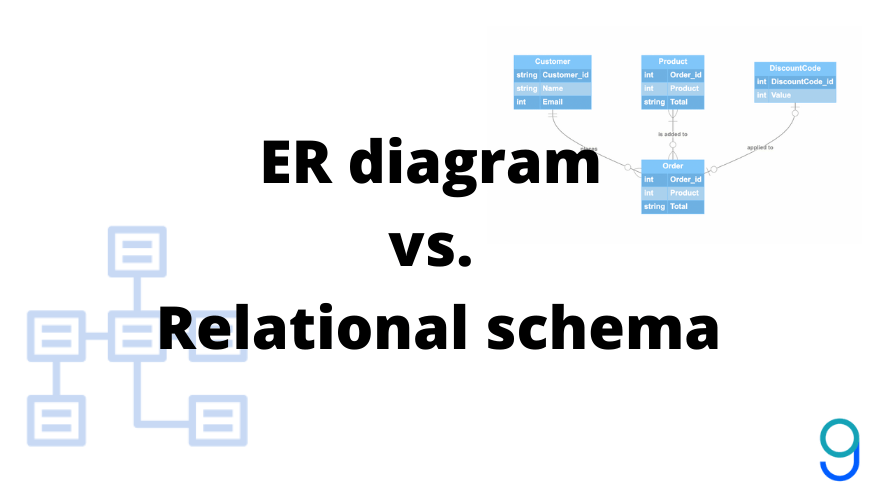
What is a relational schema? A relational schema is a blueprint used in database design to represent the data to be entered into the database and describe how that data is structured in tables (called relations in relational schemas). The schema describes how those tables relate to each other. In the relational schema, the table,…
Constantine Nalimov
18 November 2020
What are database entities? We create databases to store information about things that exist in the real world. If it can be uniquely identified as being separate from other things and recorded in a database, it can be a database entity. Database entities can be persons, places, events, objects, or concepts, such as a university…
Constantine Nalimov
06 November 2020
Hey Gleek.io fans, the app just got a major update! What’s new? Completely new layout engine (based on Mermaid) Diagrams are generated much faster than ever before (like lightning!) Added option to save diagram as an SVG image Added option to fit diagram into screen window (without scrollbar) Try it out yourself and create a…
greg
24 October 2020

What is process mapping? Any business activity can be described as a process if it goes through a series of steps and transforms inputs into outputs. The inputs might be raw materials, information, or human activity. The output is the finished product, document or anything that results from the series of steps. A process map…
Constantine Nalimov
15 October 2020

What is an architecture diagram? Architecture (or architectural – both are used) diagrams are primarily about making it easier to communicate and collaborate with all stakeholders in a project. An architecture diagram will show the concepts involved in the architecture, including key principles, elements, and components. They are high-level diagrams that aim to represent the…
Constantine Nalimov
30 September 2020

What is a concept map? Concept maps were first used in universities in the 1970s, but are now also used by engineers, designers, businesses, and anyone who needs to illustrate how concepts relate to each other. Creating a concept map is a way to organize, explore, and expand your understanding of a topic. When you…
greg
20 September 2020

Entity-relationship diagrams are a useful tool for designing databases. They show the entities involved, their attributes, and the relationships between them. You need to define these elements to properly understand the structure of the database before building it. A method often used to create an entity-relationship diagram is crow’s foot notation. Introduced in the 1970s, the distinctive…
Constantine Nalimov
02 September 2020

When you start working on a new project, you need to know what external entities will be involved and how they will interact with your system. A system context diagram will help you to work out these relationships without getting too involved in the details of how your system works. A data flow diagram (DFD)…
Constantine Nalimov
16 August 2020

Before you create a new database, you have to work out what elements you’ll include and how they relate to each other. That’s where the entity-relationship diagram (ERD) comes in. An ERD is ideal for rapidly sketching out a database at the conceptual level. If you plan the overall scope of what you need, you’ll…
Constantine Nalimov
26 July 2020

You will find several data modeling and management tools on the market including Gleek. It’s a text-to-diagram tool that makes it easier to perform data modeling. Like other options on this list, Gleek is free and requires no signup. It can be used to create information, class, entity-relationship, or UML object diagrams by using the keyboard…
greg
08 July 2020

Best software development tools are heavily in demand. The software industry is among the largest and fastest-growing industries out there. The whole IT industry is worth $5.2 trillion (2020), hence it doesn’t come as a surprise that more and more people want to be a part of the industry. There are more than 21 million software developers out…
greg
30 June 2020
Designing your database using the entity-relationship model The entity-relationship (ER) model is a way to design databases at the conceptual level. It relies on describing real-world entities and the relationships between them. If something can be individually identified, then you can use it as an entity in your database. Any association between entities is then recorded…
Constantine Nalimov
09 June 2020
The first premium feature for Gleek is integration with Git source control repositories. The idea was to enable users who would like to version their diagrams or are concerned with their project privacy, to use their own Git repos to store their Gleeks. For registered users, we store diagrams in Azure table storage and diagram…
Constantine Nalimov
05 September 2019

Gleek takes a completely new approach to diagraming, so we wanted to take a moment to share some tips we’ve learned having used this product over the last months during its development. Don’t try to put everything you can think of into it, instead focus on the most important idea you are trying to communicate…
Constantine Nalimov
31 August 2019
Hi all, thanks for stopping by. I hope you’ve already played around with Gleek a bit, but if not, have a look here to give it a try. Gleek is an app that we built to scratch an itch we’ve had at Blocshop for a long time. We are a software development company that works almost exclusively with remote…
greg
22 August 2019