
What is UML?
UML, which stands for Unified Modeling Language, is a set of definitions and symbols used to visualize and describe the connections in a software system. It’s not a programming language like Java or HTML, but is instead a visual language used in modeling diagrams. UML makes the processes and relationships within a system much easier to see and understand.
UML diagrams can either be structural, or behavioral. In structural UML diagrams, we can see the unchanging, architectural relationships in a system. Behavioral diagrams show the changing or dynamic features in a system, like connections and communication. Some examples of common structural diagram types are class, component, and object diagrams. A few behavioral diagram types include activity, communication, and sequence diagrams.
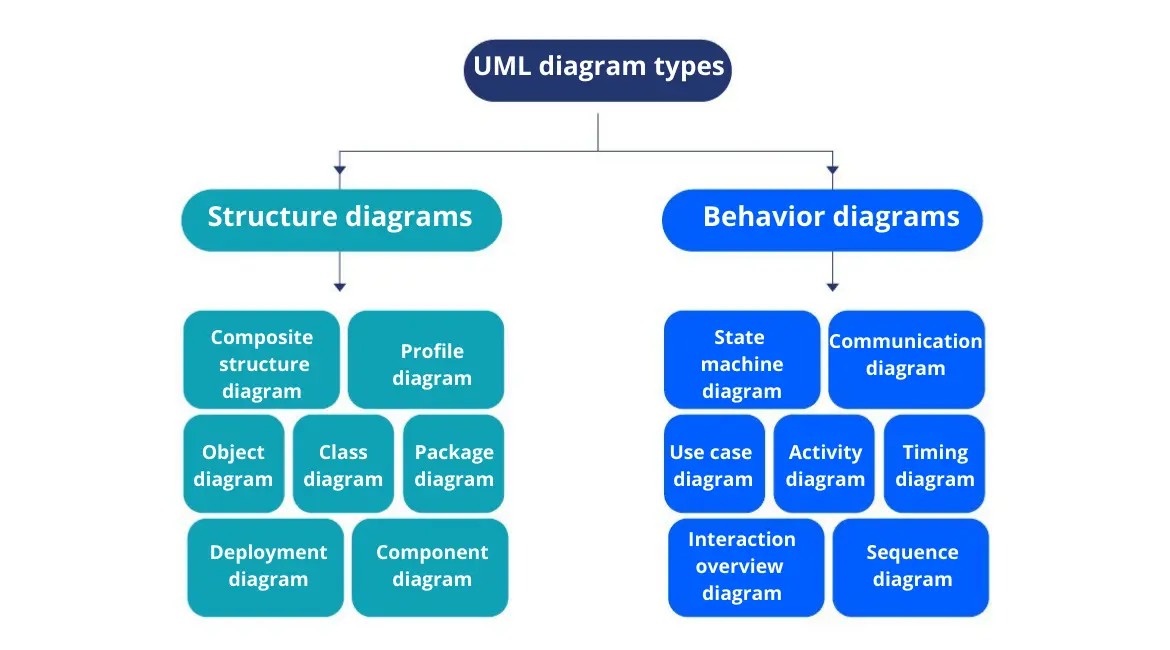
UML diagram types
Read our recent article to learn more about other UML diagram types.
What is a UML communication diagram?
UML communication diagrams, formerly known as collaboration diagrams, show the relationships between objects, and how messages flow between applications. Here are the main uses of communication diagrams:
Shows the architectural design of a system
Model the messages sent and received by different applications
Shows relevant objects, their classes, and their message parameters
Model other scenarios between other objects within the same use cases
Make your own UML diagram with Gleek.
Communication diagram symbols and elements
Symbols
These are the shapes and figures that make up UML diagrams.
Numbers: Numbers show the order in which messages are sent, as well as how many messages are required to complete a process.
Rectangles: A simple shape with a simple purpose, rectangles are used to show the objects in the system. They are labeled with the object’s name.
Lines: Lines connecting rectangles show the relationships between two or more objects
Arrows: These show the flow of messages sent and received throughout the process in the diagram.
Elements
Elements are the components of a system, represented in diagram form.
Objects
There are two types of objects presented in a communication diagram.
Supplier objects – These objects supply the method, or process. Supplier objects are the message receivers.
Client objects – These objects send messages to request supplier methods.
Links
Lines represent the links between objects. They show which objects are connected, and how. They also show which objects send and receive messages. Sometimes, an object sends messages to itself, which is represented with a loop.
Messages
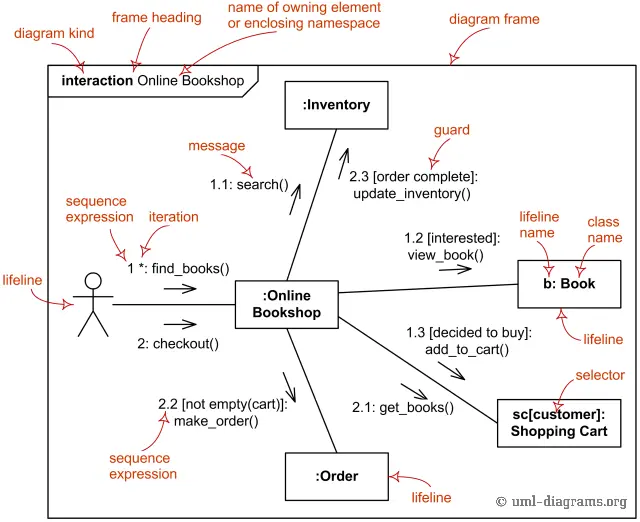
While lines represent links, arrows represent the flow of messages. Client and supplier objects are connected with arrows, and labeled with numbers. Messages are numbered in sequential order; 1, 2, 3, for example. The numbers on a diagram are also for the reader’s benefit, because you know which messages to read first. If a message is attached to a parent message, it can be expressed with multiple numbers and decimal points. There will also usually be a short description next to each number. There are two types of messages:
Synchronous messages – After a client object sends a message, it must wait for a response from the supplier. These messages are represented by a solid line, and a filled in, triangular arrowhead.
Asynchronous messages – The client object, after sending a message, does not need to wait for a response before continuing. These messages are shown with a dashed line and a ‘hollow’ arrowhead.
Activity
Activities, which are actions that must take place for the process to be completed, can be represented by an oval, or another shape.
Frames
Frames are the spaces that contain diagrams, like a picture frame. The title or heading of the diagram is located in the upper left corner.
Please note that these are not all of the symbols or elements that you can find in a UML diagram. There are a few others that you’ll see along the way.
UML Communication Diagrams Overview
How are sequence diagrams used?
We’ve already covered the main uses of communication diagrams, so here are some things that sequence diagrams are used for:
To see the order, or sequence, of interactions in a system.
Shows the interactions between the user and the system, as well as interactions between systems, and with any present subsystems.
Model all potential paths an interaction can take
Model object interactions in regards to their use cases
The UML of sequence diagrams is almost identical to that found in communication diagrams.
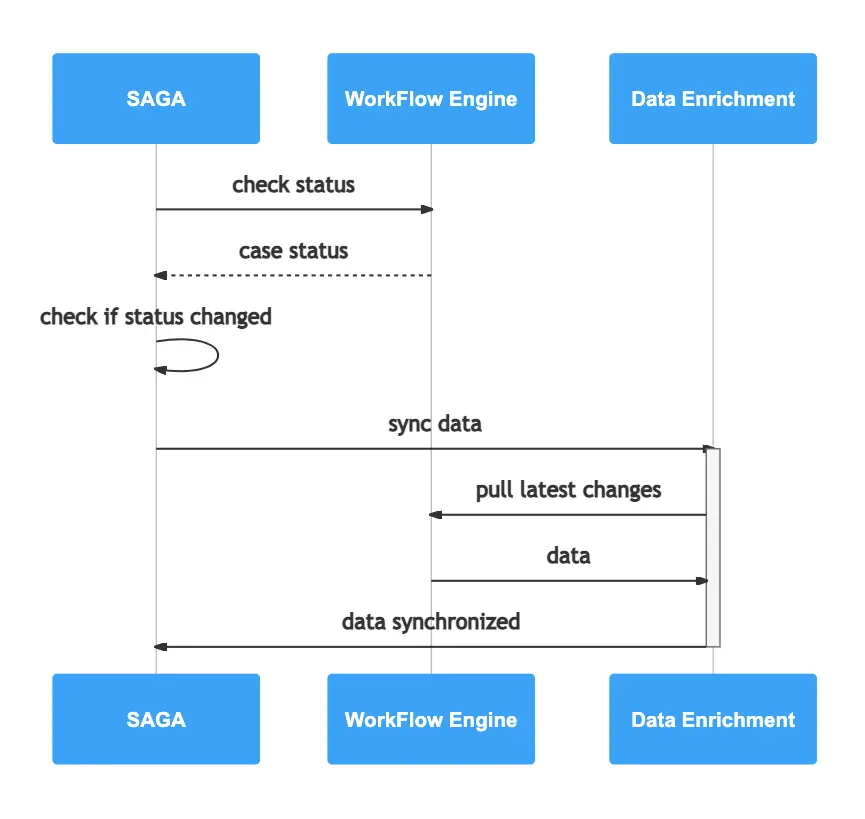
Sequence diagram via Gleek
Communication diagrams vs. sequence diagrams
Sequence and communication diagrams both use UML, and both can be used to show the same systems. In fact, it’s quite easy to change a communication diagram into a sequence diagram, or vice versa. Though they show the same information, there are differences between the two that must be recognized.
Sequence diagrams:
Emphasize time, and order of operations
Difficult to see relationships between objects
Best used in the early analysis stages
Time-ordered, dynamic model
Single use case with multiple scenarios
Supported by Gleek
Make your own UML diagram with Gleek.
Communication diagrams:
Emphasize relationships and messages between objects
Difficult to see sequence and timing of processes
Best used to show behaviors between objects that cannot be completed without other objects. Meaning, objects must collaborate to perform the process.
Static model, not time-ordered
Used to describe the organizational structure of the system for several use cases
Not fully supported on Gleek
In summary, communication and sequence diagrams both display similar information, but in different ways. Communication diagrams can show a little bit of everything, especially the relationships between objects, while sequence diagrams focus more on the logical sequence of events. Both diagram types are helpful for use case realization.
Gleek and diagrams
As stated before, Gleek currently does not allow for the creation of detailed UML communication diagrams. However, it is possible to create very simple diagrams that show only the links between objects, but without arrows. However, you can create a fully detailed sequence diagram using Gleek.
Gleek is a text-based diagramming tool that allows you to make many different types of charts and diagrams without ever touching your mouse. It is easy to use for even the most technically challenged. Get started on your diagram for free here, or check out our series of tutorials.
Related posts
Sequence diagram for ATM withdrawal: a step-by-step guide
Activity vs. sequence diagrams: what’s the difference?
What does UML mean in business analysis?