
Understanding the world of data management begins with a deep dive into Entity-Relationship Diagrams (ER Diagrams). These diagrams serve as the blueprint for designing or understanding database schemas, illuminating the different entities in a system and the relationships between them.
Definition and Importance of ER Diagrams
An Entity-Relationship Diagram, often abbreviated as ER Diagram, is a visual representation of data within a system. It maps out how different entities (objects, concepts, or things with data) relate to one another. This could be anything from individuals in an organization, to the products in a store, or even the books in a library.
ER Diagrams are invaluable tools in both the design and analysis stages of a database schema. They provide a clear, organized view of a system's structure, facilitating easy understanding and communication about the system. ER Diagrams also aid in identifying potential issues or inefficiencies in a database, making them a crucial part of maintaining data integrity and optimizing performance.
Learn more about What is the entity-relationship diagram in database design.
Overview of Components in ER Diagrams
An ER Diagram comprises several key components:
Entities: These are the real-world objects or concepts that the diagram represents. Entities can be tangible (like a person or a product) or intangible (like an event or an idea). Entities in an ER diagram are categorized into two types: strong entities and weak entities.
Attributes: These are the properties or characteristics that define an entity. For instance, a 'Person' entity might have attributes like 'Name', 'Age', and 'Address'.
Relationships: These show how entities interact with each other. Relationships can be one-to-one, one-to-many, or many-to-many.
Constraints: These are the rules or limitations applied to entities or relationships. Constraints can define how entities relate to one another and set boundaries for attributes or relationships.
In the next sections, we will dig deeper into these components and focus on a special kind of attribute: the derived attribute - a unique concept that plays a significant role in ER diagrams.
Make your own ER diagram in Gleek.
Understanding Derived Attributes
Definition of Derived Attributes
Derived attributes are a class of attributes in ER diagrams that aren't stored directly within the entity; instead, they are computed or derived from other base attributes. These derived attributes do not contain their own data; rather, their values are calculated from existing data within the database.
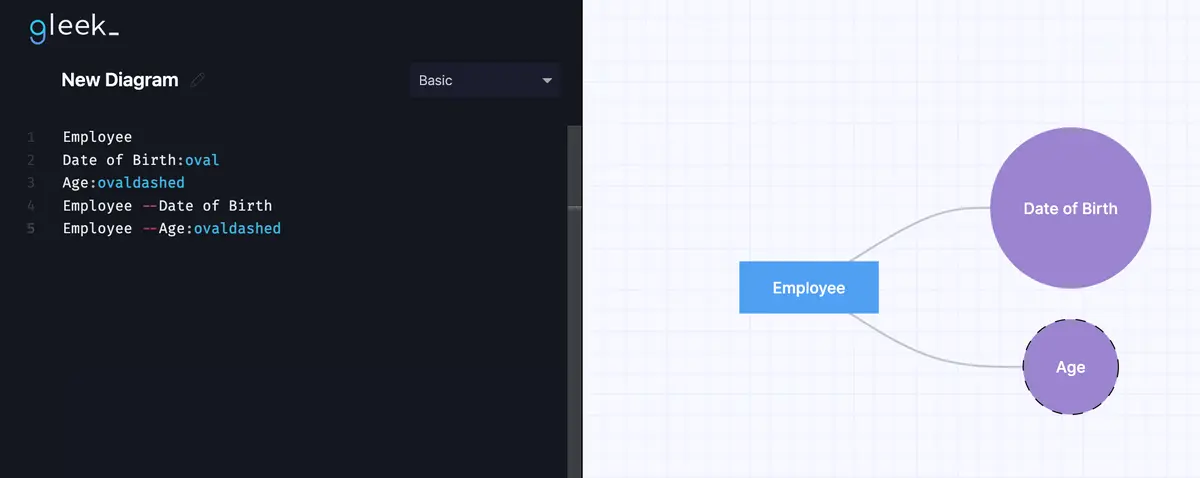
For instance, consider an entity 'Employee' with a base attribute 'Date of Birth.' A derived attribute for this entity could be 'Age,' which isn't stored directly but calculated based on the current date and the employee's date of birth.
The Role and Significance of Derived Attributes in ER Diagrams
Derived attributes bring several advantages to the table. First and foremost, they save storage space. Since derived attributes are calculated on the fly and not stored directly in the database, they help conserve valuable storage resources.
Secondly, derived attributes ensure data consistency. By deriving certain attributes from existing data, we eliminate the possibility of errors or inconsistencies that may arise from manually inputting or updating these values.
Lastly, derived attributes can improve query performance. When dealing with complex queries that require calculated data, having derived attributes can significantly speed up the querying process.
Understanding the relationship between base and derived attributes is a critical aspect of creating efficient and effective ER diagrams.
The Connection Between Derived and Base Attributes
How Derived Attributes Are Created From Base Attributes
As we mentioned in the previous section, derived attributes are calculated from one or more base attributes. They are not stored within the database itself, but rather, their values are computed when needed based on existing data.
The process of deriving an attribute involves defining a rule or formula that calculates the derived attribute's value from the base attribute(s). This rule can vary greatly depending on the specific requirements of the system. For example, it could be a simple mathematical calculation, a concatenation of strings, or even a complex algorithm.
Make your own ER diagram in Gleek.
It's worth noting that while derived attributes increase efficiency by saving storage space and ensuring data consistency, they also require computational resources each time their values are calculated. Therefore, striking a balance between storage efficiency and computational efficiency is key when deciding which attributes should be derived.
Examples of Derived Attributes in Real-World Scenarios
To illustrate the concept of derived attributes further, let's consider some real-world examples:
Employee Age: In an 'Employee' entity, 'Age' can be a derived attribute. It's calculated based on the 'Date of Birth' base attribute and the current date.
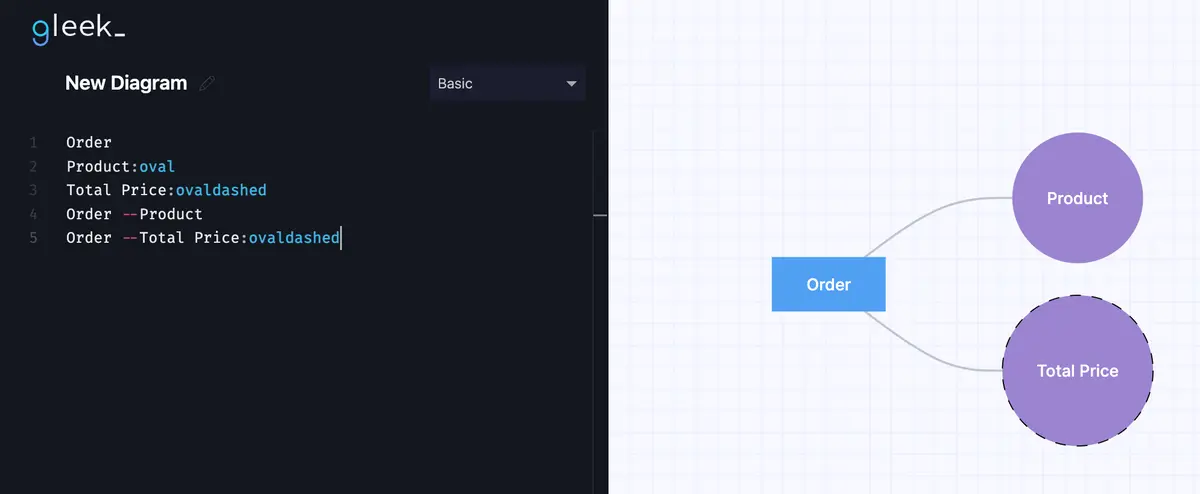
Order Total: In an 'Order' entity, 'Total Price' can be a derived attribute. It's calculated by summing up the prices of all the 'Product' entities associated with that order.
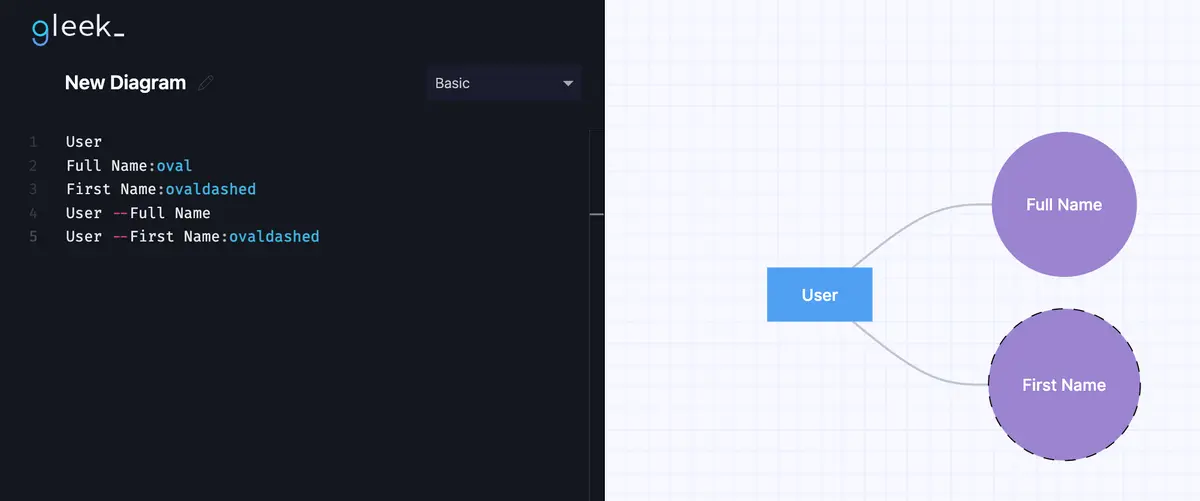
Full Name: In a 'User' entity, 'Full Name' can be a derived attribute. It's created by concatenating the 'First Name' and 'Last Name' base attributes.
How to represent derived attributes in ER diagram
Using Gleek
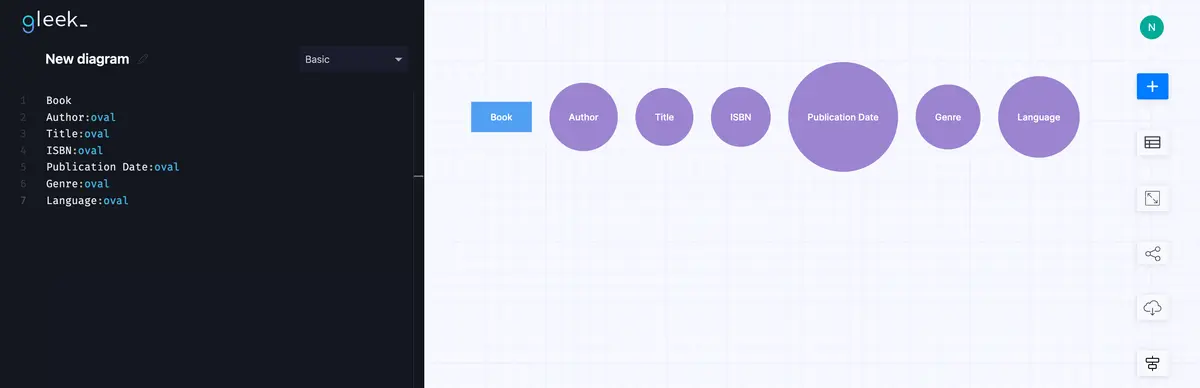
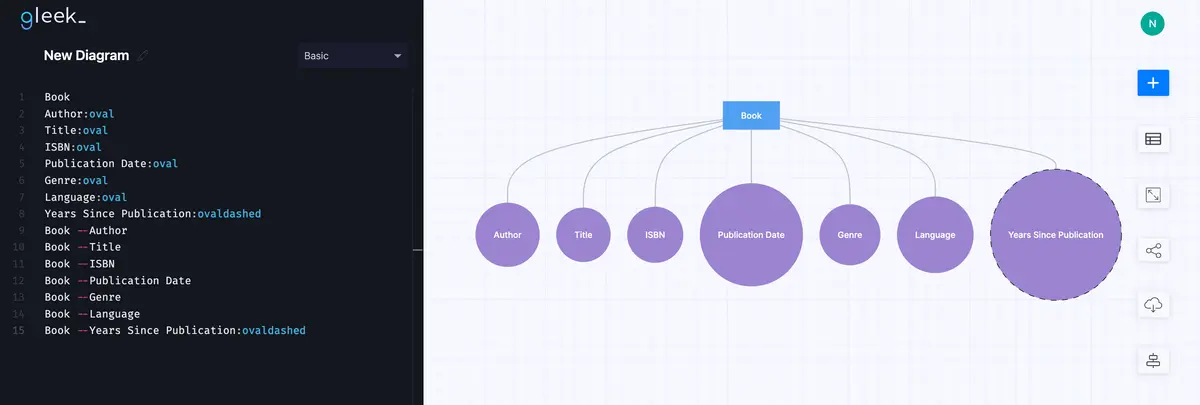
Let's consider a scenario where we design a database for a bookstore's online platform. Here, we'll focus on the "Book" entity. The basic level attributes for a book might include its title, author, ISBN, genre, publication date, and language. These attributes provide fundamental information about each book in the database.
In this scenario, the "Book" entity is also represented by a rectangle with the word "Book" inside it.

The simple attributes for the "Book" entity (title, author, ISBN, genre, publication date, language) are represented by ovals.
Now, we'll add a derived attribute. In this case, a suitable derived attribute could be "Years Since Publication", which is calculated from the current date and the publication date of the book.
A derived attribute is visually distinct from a usual attribute in diagrams. While a usual attribute is depicted with a solid oval shape, a derived attribute is represented by an oval with dashed borders. This distinction is important for understanding how data elements are related and how some values are computed based on others.
If you're using the Gleek app and want to create a custom shape for a derived attribute but only have access to a basic set of shapes in the free version, you can upgrade to a Premium license to unlock the ability to create custom derived attribute shapes. Here's how you can do it, step-by-step:
Upgrade to Premium: Ensure that you have a Premium license for Gleek to access the custom shape creation feature.
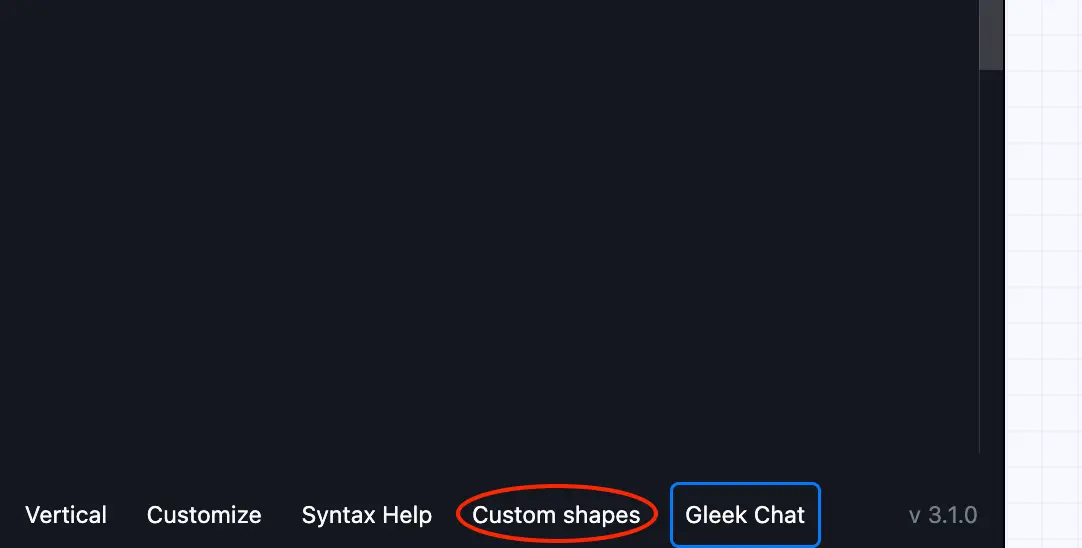
Access Custom Shapes: Once you're in the Gleek app, navigate to the "Custom Shapes" section. This option is usually found in the settings or tools menu.
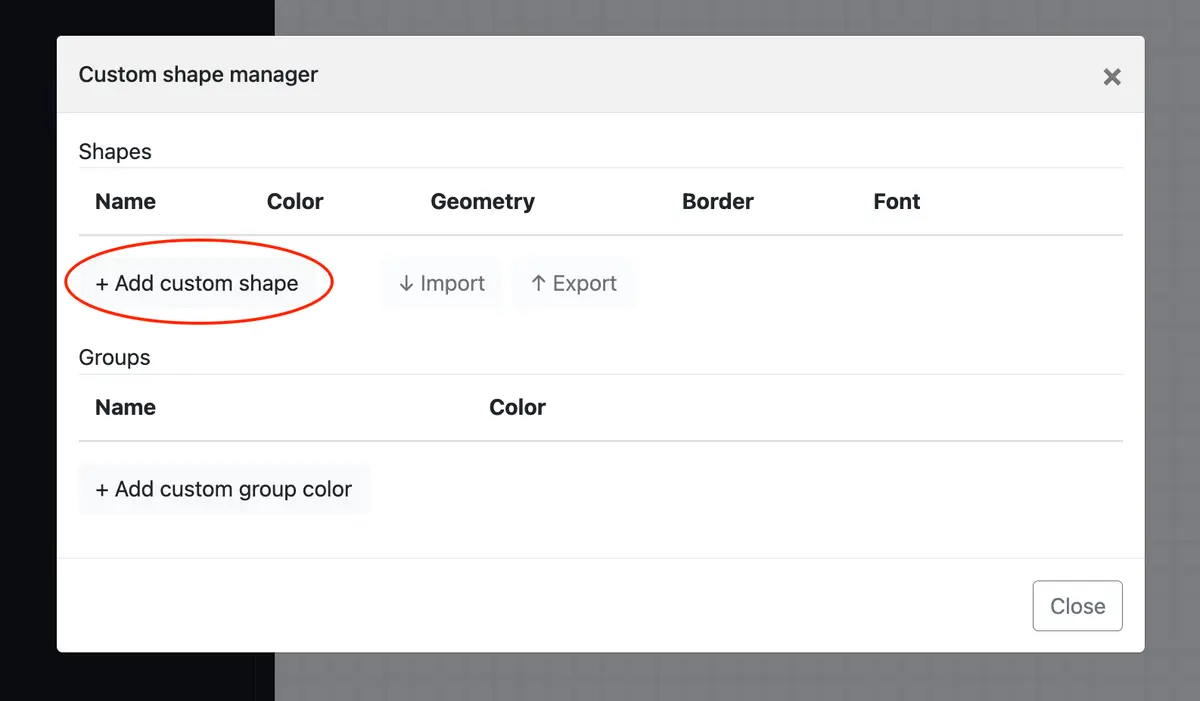
Create a New Shape: Click on "Add custom shape" to start creating a new shape for your derived attribute.
Configure the Shape:
Give your shape a name, such as "OvalDashed" for clarity.
Choose a color for your shape, like #9b85d0, to make it visually distinct. This color selection can help in quickly identifying the nature of the attribute in your diagrams.
In the "Geometry" section, select "Oval" as the base shape.
In the "Border" section, select "Dashed" to differentiate it from the usual attributes. Ensure the border color is set to black or another color that stands out against the diagram's background.
Select a Font from the list if you want to customize the text style within your shape.
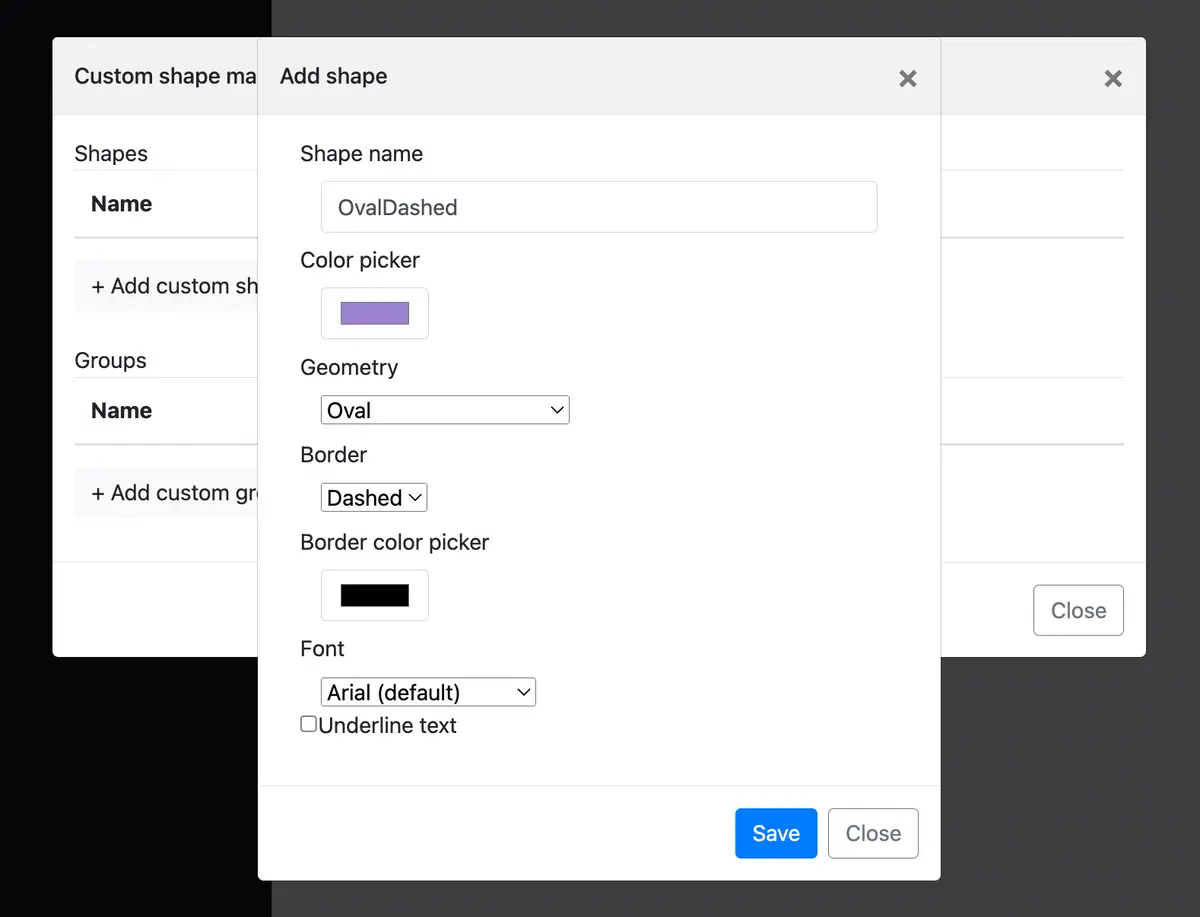
5. Save the Shape: Once you've configured your shape, click "Save" to add it to your list of custom shapes.
Make your own ER diagram in Gleek.
6. Use the Shape in Diagramming: Go to the diagramming mode, type your derived attribute (e.g., "Years Since Publication"), followed by two dots (:), and select your new custom shape from the list.
By following these steps, you can create a visually distinct representation for derived attributes in your database diagrams, enhancing the clarity and understanding of your database's structure. The process may seem technical, but with practice, it becomes an integral part of your data modeling toolkit. Remember, precision and functionality are key in diagram creation, and Gleek offers just that.
Wrapping Up: Mastering Derived Attributes for Efficient ER Diagrams
It's clear that ER Diagrams offer significant advantages when it comes to designing efficient and effective data models.
Derived attributes, generated from base attributes through predefined rules or formulas, allow us to optimize storage space while maintaining data consistency. While they do require computational resources for their calculation, the balance they provide makes them invaluable in many scenarios.
The Gleek app, with its technical and concise interface, helps streamline the process of incorporating derived attributes in your ER diagrams. Its premium version offers the ability to create custom shapes for derived attributes, enhancing the visual distinction and clarity of your diagrams. This feature, coupled with Gleek's focus on keyboard shortcuts and efficiency, makes it an outstanding tool for diagram creation.
In the end, mastering derived attributes involves understanding the balance between storage and computational efficiency, knowing when to use them, and being able to represent them effectively in your ER diagrams. With practice and the right tools, like Gleek, you can utilize the power of derived attributes to design more precise, functional, and efficient ER diagrams.
Remember, in the world of database design, every attribute counts. So, make them count wisely.
Related posts
All about ER model cardinality with examples
How to represent a weak entity in ER diagram
Relational schema vs. ER diagrams: A detailed comparison
Guide to entity-relationship diagram notations & symbols
How to show multiplicity in an ER diagram?
How do you convert an ER diagram into a relational schema?
What is an associative entity in an ERD?
What is the entity-relationship diagram in database design?
Crow’s foot notation in entity-relationship diagrams
Crow’s Foot vs. Chen notation: detailed comparison for 2022
Enhanced entity-relationship diagram: features and components
ER diagram for a hospital management system (Crow’s Foot notation)