
There are a lot of things to learn about ER diagrams before you can read and understand them. Things like entities, attributes, symbols and notations are all important to know about, including how they are represented, before trying to make sense of an ER diagram. Another important aspect of ER diagrams is cardinality and relationships. All of these components work together to show the parts of a database, the details of the objects within the database, and how they relate to other objects.
Make your own ER diagram in Gleek.
What is the Entity-Relationship model?
The Entity-Relationship model shows the structure of a potential database using Entity-Relationship diagrams, and these diagrams focus on individual parts of the database, and how they interact with one another. Developers use these diagrams to make the planning process easier to visualize.
Entities in ER diagrams can be things like events, people, records, or any other things that a database can record. In an ER diagram, entities are classified as either strong or weak types. They are represented in squares or rectangles.
Attributes are properties that entities have. Things like dates, names, email addresses, and passwords are some examples of attributes that are attached to an entity. Attributes come in various types such as simple (indivisible), composite (consisting of multiple simple attributes), and derived (calculated from other attributes). Within diagrams, attributes are shown in ovals. However, in some notation types, attributes are listed inside the entity shape.
Symbols and notations are markings on the diagram that convey a lot of different information. There are a few types of common notation styles, like Chen notation, Arrow notation, and Crow notation. While the symbols used may vary between each notation type, they are easy to understand and remember. Symbols can include arrows or lines, as well as numbers and letters. Usually these symbols tell the reader about the relationship instances entities have with one another.
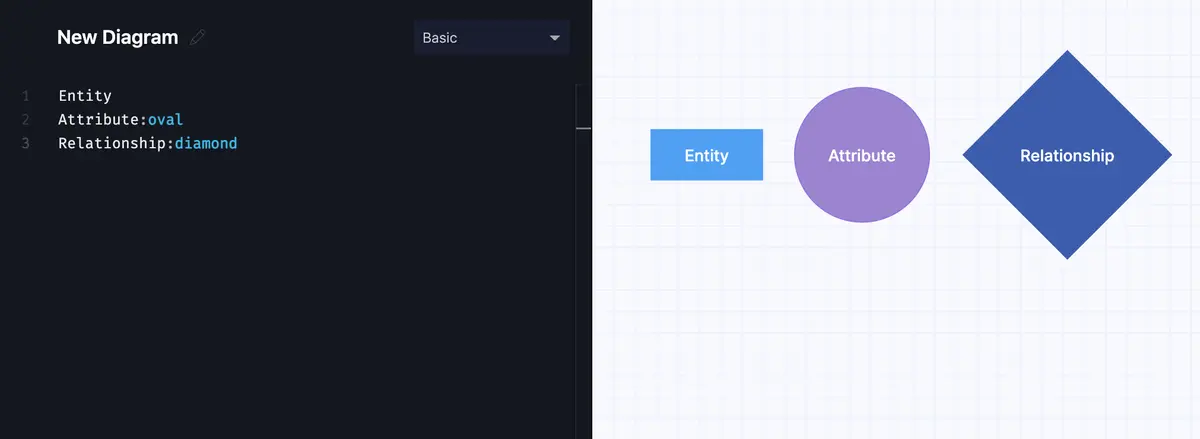
ERD components: Entity, Attribute and Relationship.
Cardinality is the number of relationships or instances one entity has with another. Sounds simple, but let’s take a closer look at what this means, and how we show cardinality in ER diagrams.
What is cardinality?
Cardinality is a mathematical term, and as stated above, it tells us the number of interactions entities have with each other. Cardinality is simply a number ratio expressed in symbols, like one-to-one or one-to-many.
Optionality is an aspect of cardinality, and it tells us whether or not a relationship is mandatory, or optional. It is possible to have a relationship that is mandatory on one side, and optional on the other.
Types of ER model cardinality relationships
There are four types of ER model cardinality relationships in Chen notation, one of the most widely used notation types. Chen notation focuses more on cardinality data modeling than other notations, so all of these examples were created using Chen notation. Curious to know more about Chen notation? Take a look at our recent post comparing Chen and Crow notations.
Make your own ER diagram in Gleek.
Chen notation
The one-to-one relationship
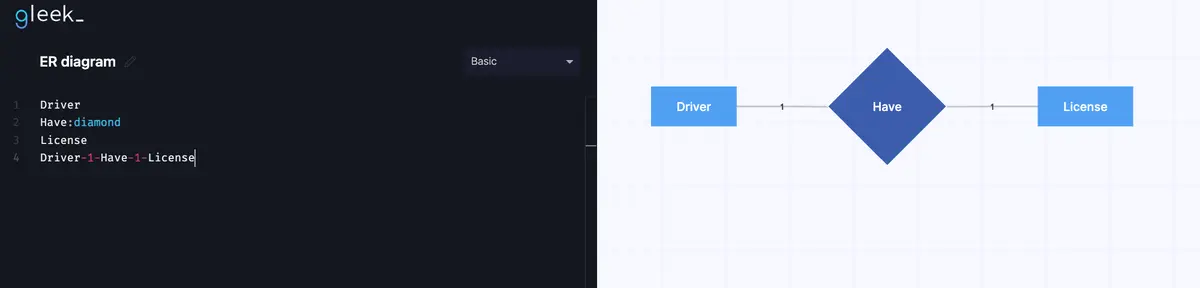
In an ER diagram, the one-to-one (1:1) relationship means that one entity has only one event shared with another entity. For example, let’s examine drivers and driver’s licenses. Each driver can only have one license, and each license can only be assigned to one driver. The one-to-one relationship is shown with a short perpendicular line on the relationship line that connects two entities.
The one-to-many relationship
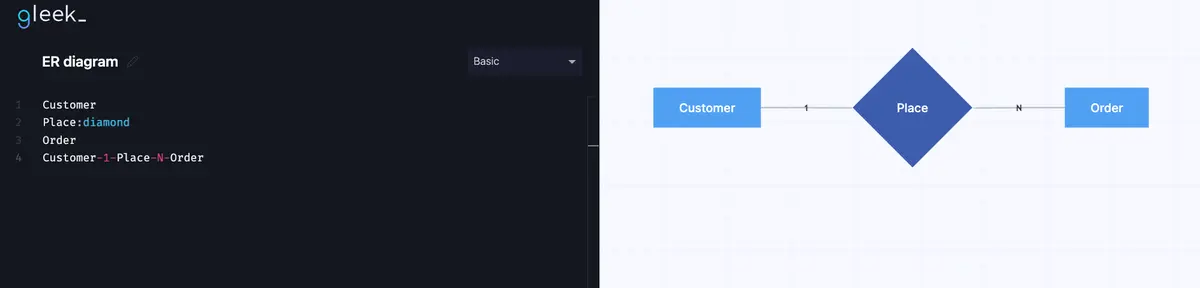
With this one-to-many (1:N), one entity has an event that occurs one time, while the other entity can have more than one repetition of the event. Take for example a customer placing an order at a restaurant. Each customer only places an order one time, but many orders are placed. In this diagram, the one relationship is shown by the number 1, and the many is shown with N.
The many-to-one relationship
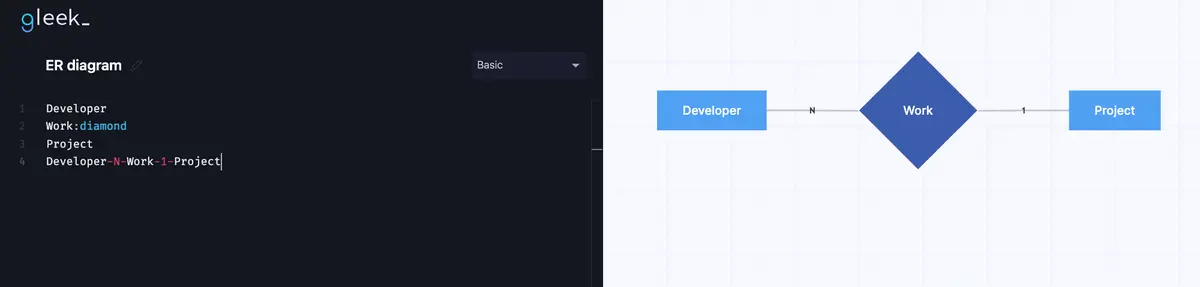
The opposite of the one-to-many relationship is the many-to-one relationship. The developer and the project are both entities, and ‘work’ is the event. Many developers work on the project, but there is only one project that they are working on. In the many-to-one cardinality, ‘many’ is represented with M, and the one instance is shown with the number 1.
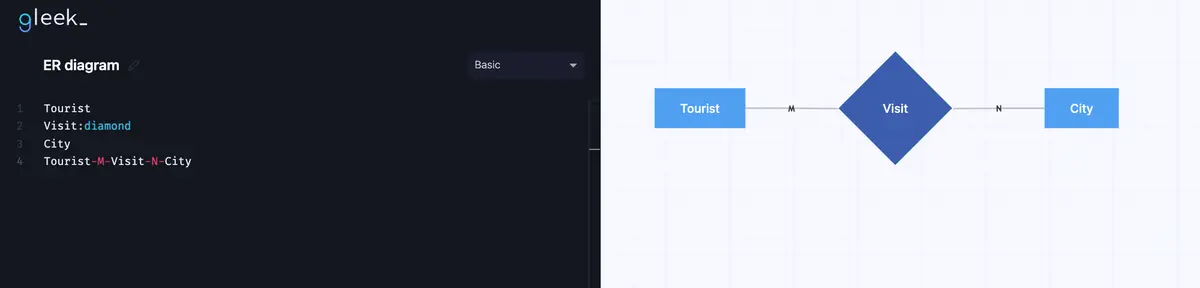
The many-to-many relationship
Many-to-many relationships are when both entities have the same event or relationship happen more than once. Below, we have the entities of tourists and cities, with the event ‘visits’. Many tourists visit, and many cities are visited by tourists. The first relationship is shown by M, and the second is with N.
Crow’s notation
In Crow’s foot notation, cardinality is represented with two graphic symbols on relationship lines, one being mandatory, and the other being ‘multiplicity’. Multiplicity is the maximum number of instances an entity can have with another, and the mandatory relationship is the minimum number of times an instance occurs, which will either be one or zero. The multiplicity symbol is closest to the end of the relationship line, with the mandatory symbol behind it.
Make your own ER diagram in Gleek.
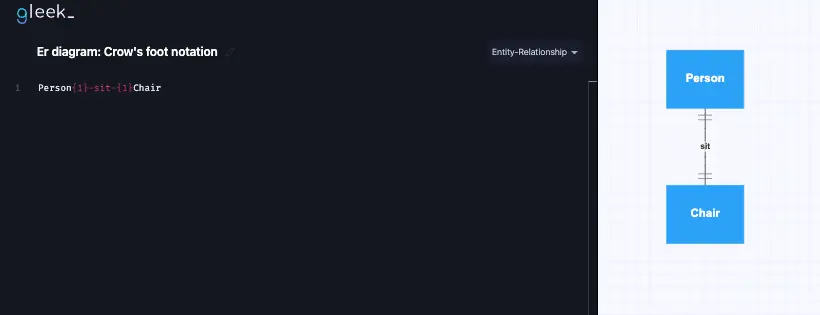
The one-to-one relationship
In relationships where both the multiplicity and mandatory relationship are one, two perpendicular lines are used. For example, think of a chair and a person. One and only one person can sit in a chair, and each chair can only seat one person.
Read our recent article on multiplicity in the ER diagram.
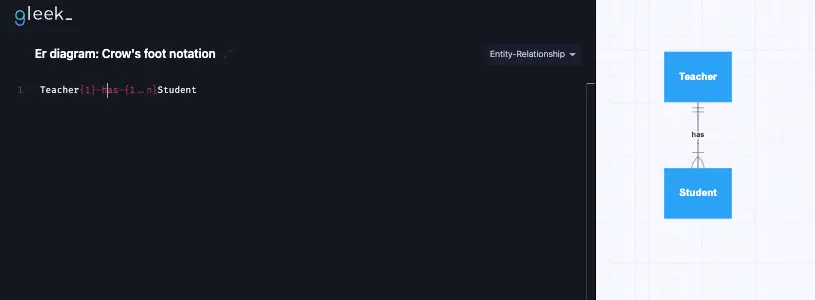
The one-to-many relationship
In the one-to-many relationship, one side of the relationship has a maximum and minimum number of instances of one, while the other side has one or many instances. The indicator for more than one relationship is a branching set of three lines, like a crow’s foot. In a classroom, a student has one teacher, but the teacher has one or many students.
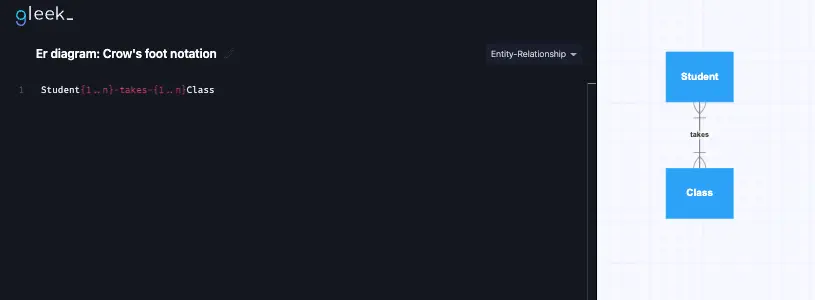
The many-to-many relationship
Each side of the relationship line has crow foot symbols and a mandatory relationship of one. Going back to our student and school example, each student takes one or many classes, and each class has one or many students.
These example diagrams were all made using Gleek. Looks simple, right? Gleek is a breeze to learn, and you’ll be creating diagrams in no time with a series of keyboard commands. You can make ER diagrams of many types, and easily implement Chen and Crow notations. Try out Gleek for free, or have a look at our tutorials to learn more.
Related posts
ER diagram example: online shopping system (Crow’s Foot notation)
Guide to entity-relationship diagram notations & symbols
Composite and other attributes in the entity-relationship model
UML vs. ER diagrams: A detailed comparison
Crow’s foot notation in entity-relationship diagrams
How do you convert an ER diagram into a relational schema?
Enhanced entity-relationship diagram: features and components
What is the entity-relationship diagram in database design?
ER diagram for a hospital management system (Crow’s Foot notation)