
So you’ve signed up with Gleek and you want to make some diagrams. But you’re not sure where to start…
Don’t worry, here’s our quick start guide to using Gleek. Once you’ve read this, you’ll be happily diagramming like a pro 💪
The simplest thing you can do in Gleek is to make a shape. Let’s do that right now. Go to https://app.gleek.io in your browser and click “New diagram”. Don’t forget to sign up first. And remember that it’s free to sign up 😄
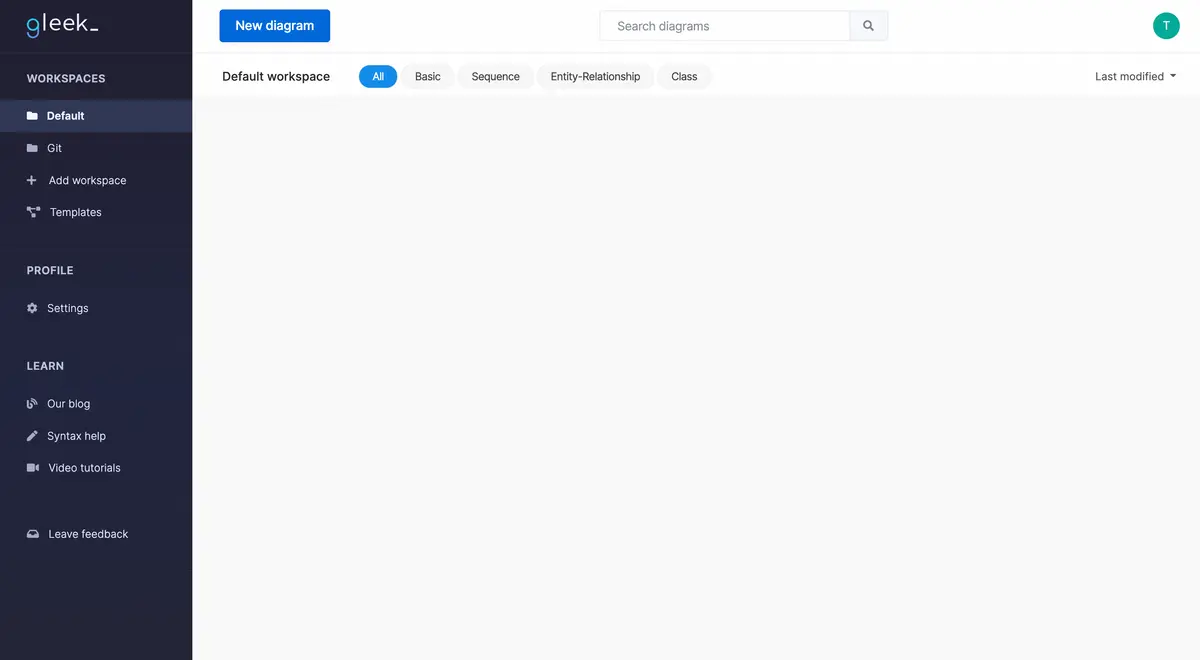
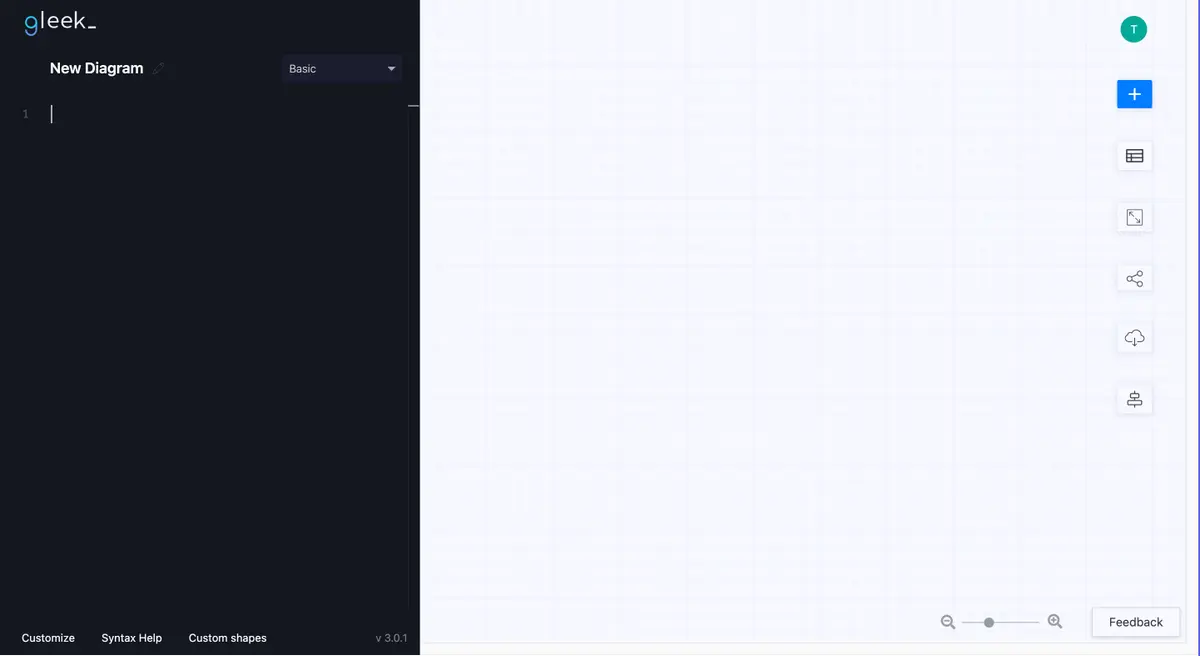
You have a clean code field, and you can start making some basic shapes. If you like, you can double-click on the “New Diagram” title and rename it to whatever you want.
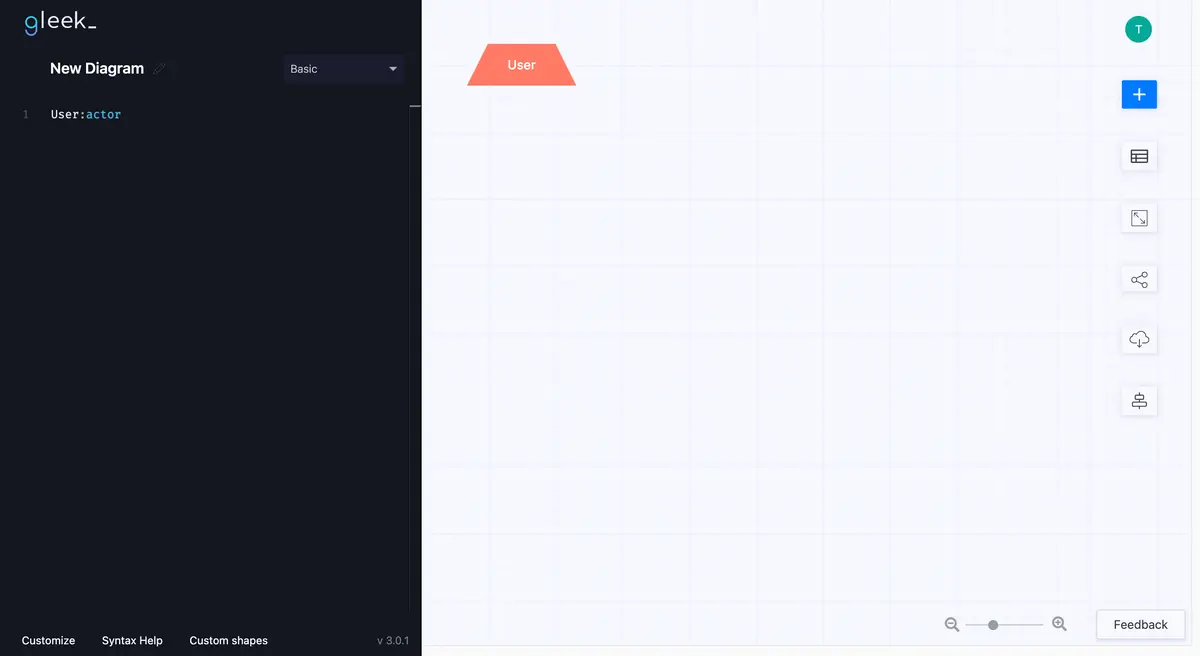
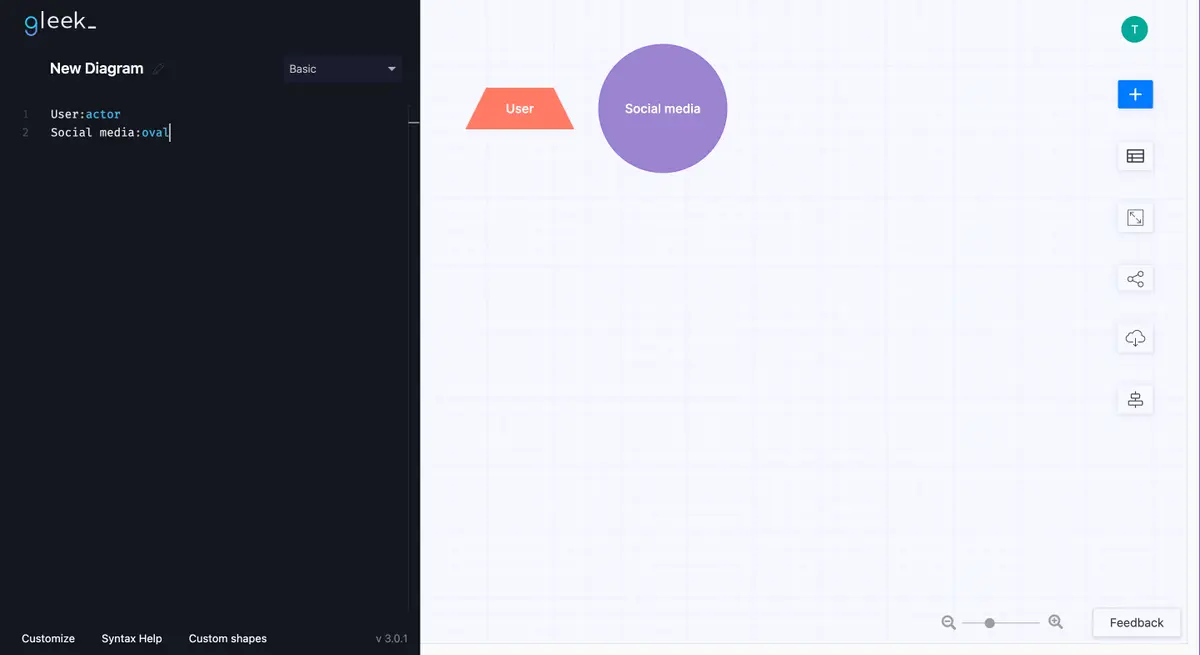
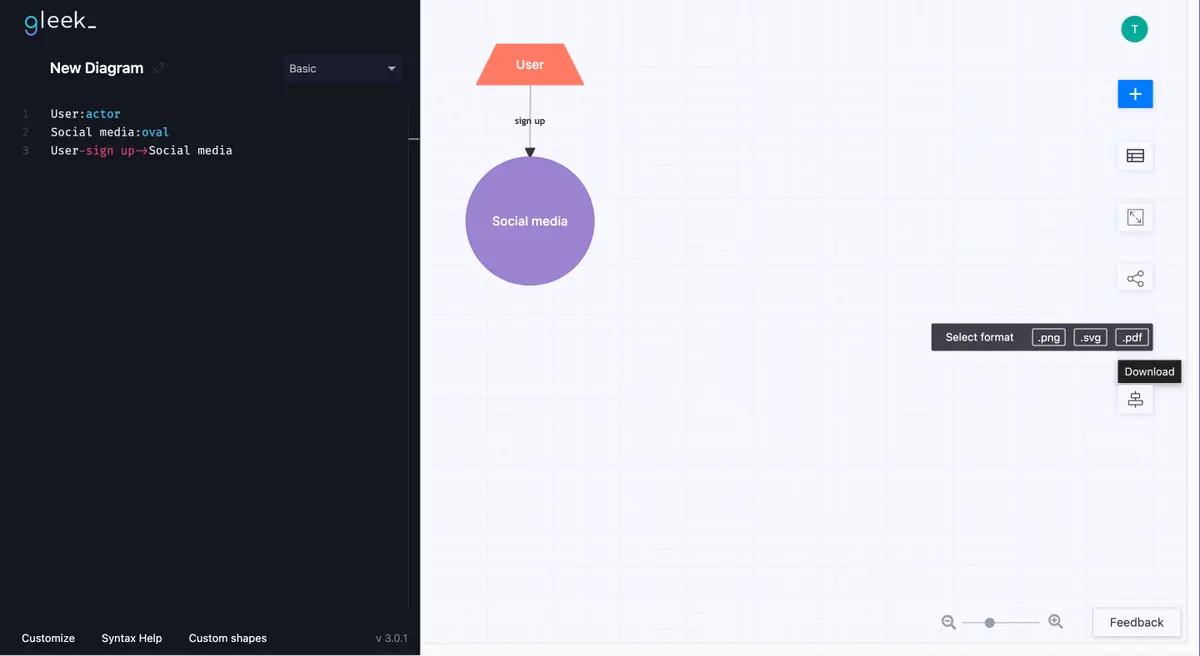
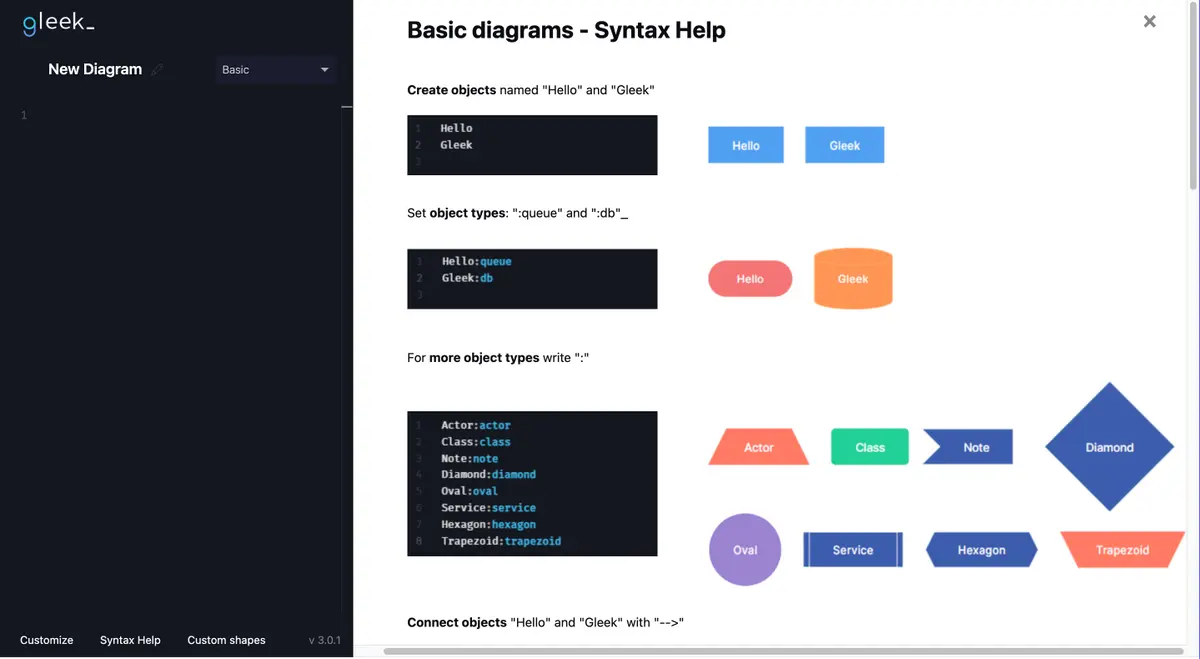
Let’s start by creating a shape to represent a user. To do this, type the word user, then type a colon. Gleek will recognize that you want to create an object and give you some autocomplete options. Our user is an actor, so let’s choose “actor”. Just find “actor” in the dropdown list and complete the shape, or just type “user:actor” and Gleek will draw the shape and name it.
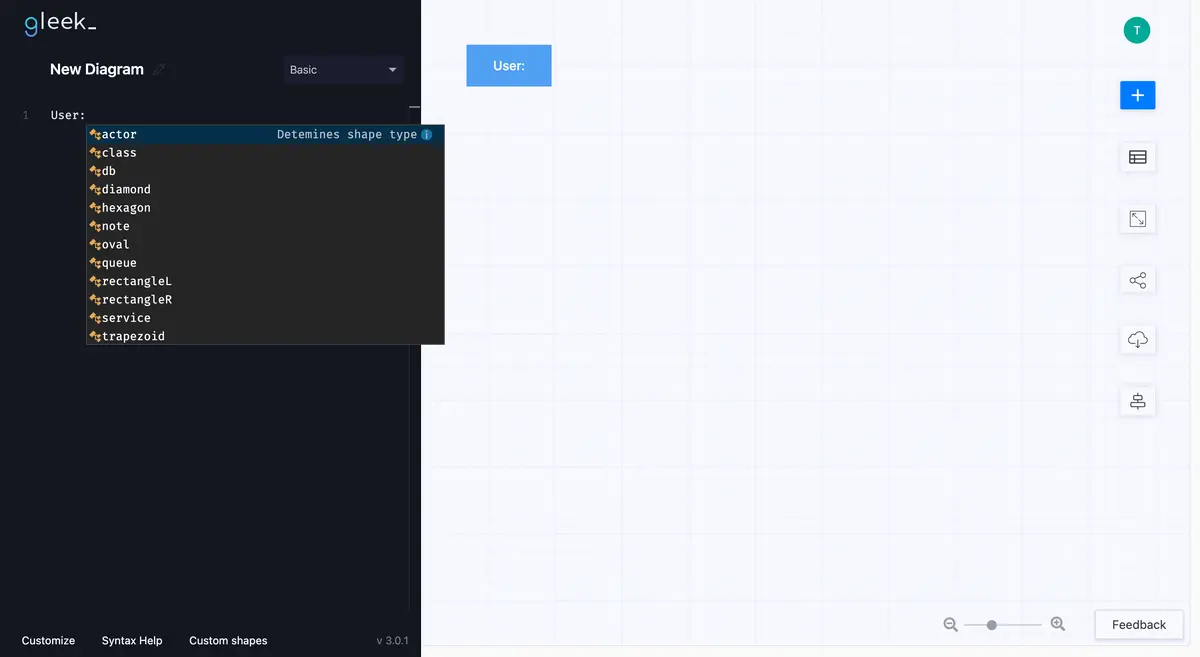
You can use lots of other objects in Gleek. You can choose from actor, class, db, diamond, note, oval, queue, service. You can also just type any word and Gleek will add it as a basic rectangle shape.
So now you have your user. Let’s add something for the user to use. We’re going to create a simple object to represent a social media platform, so just type “Social media:oval” and you’ll have what you need.
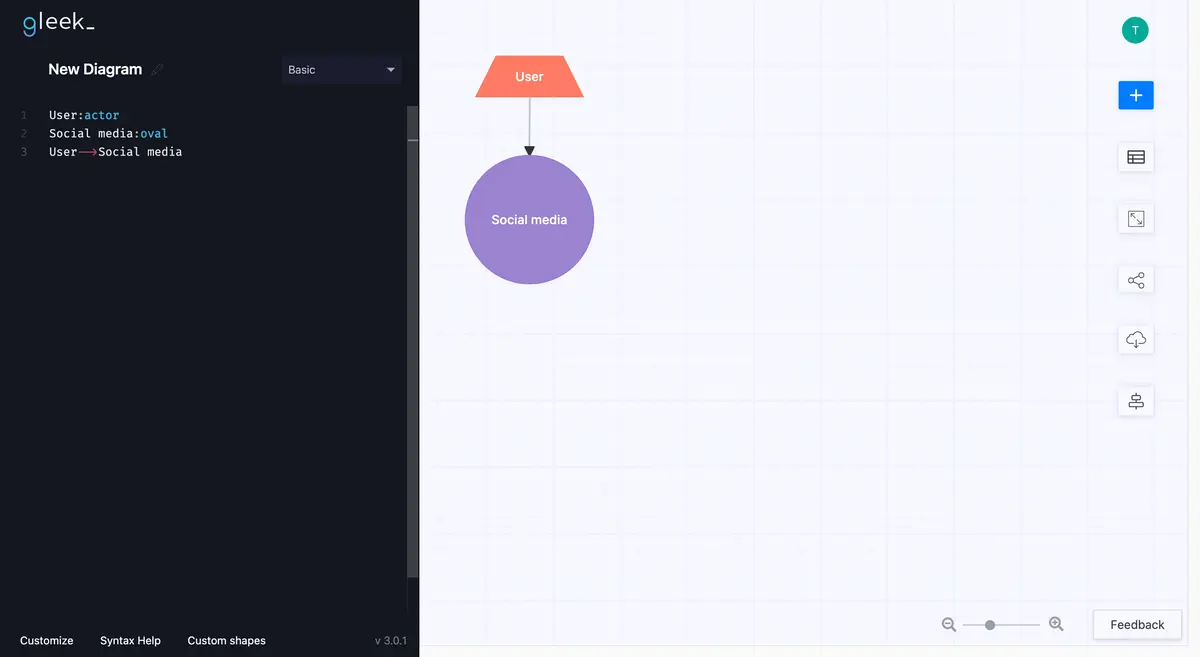
The user and the social media are sitting there in our diagram, but now they need to be connected. Creating relationships between objects in Gleek is just as easy as creating objects. No need to draw or drag anything. Just type “User–>Social media” and Gleek will draw an arrow pointing from the user to the social media platform.
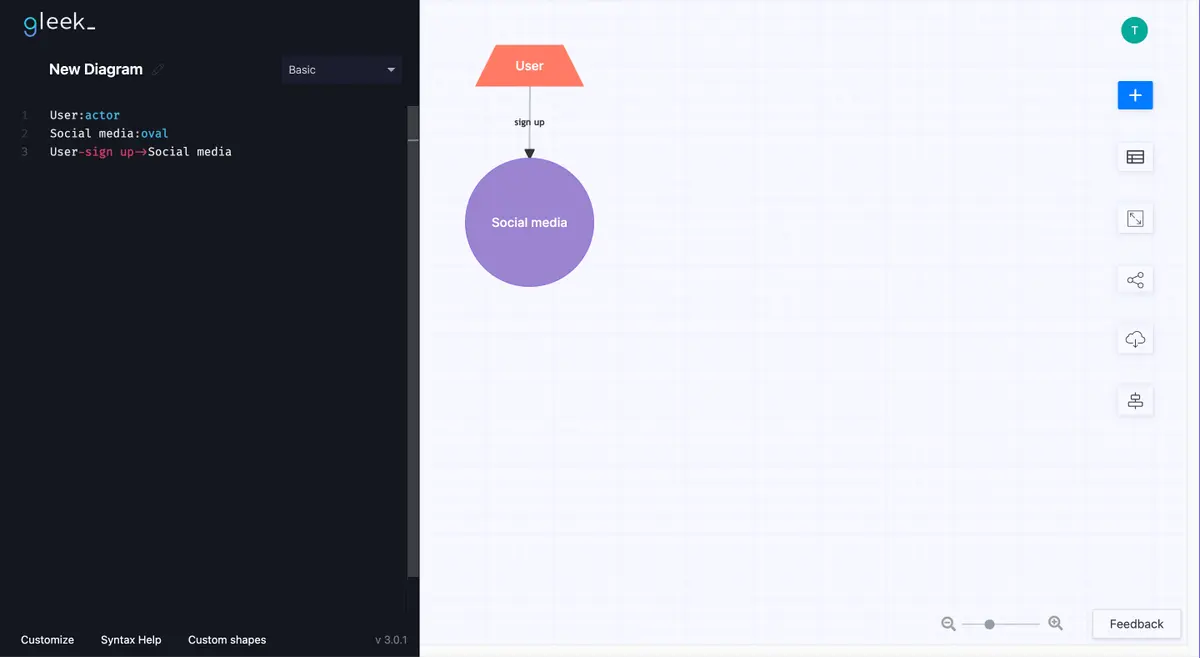
We should describe what’s happening in the diagram. Labels help to do this. The simplest interaction between the two can be that the user signs up. Just type “User-sign up->Social media” and you’ll have a labeled arrow before you know it.
You can go on to build almost any kind of diagram with Gleek’s fast and easy diagramming tools. Check out our list of suggestions to inspire you at the end of this article.
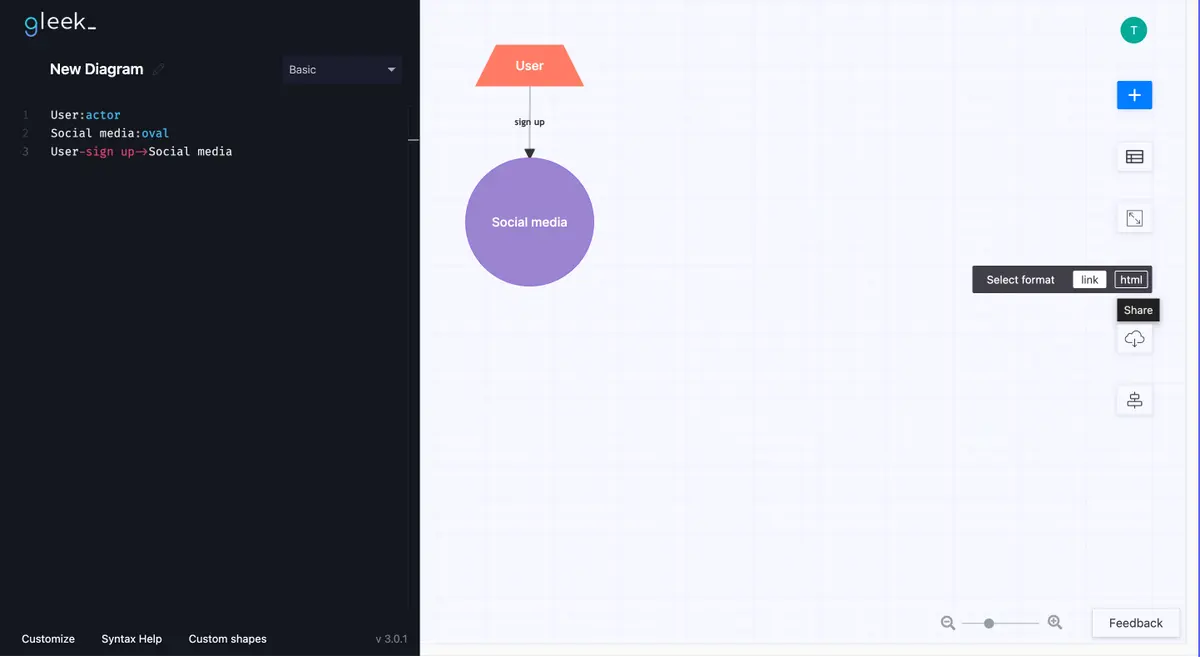
Once you’re happy with your Gleek diagram, you’ll probably want to share it. It’s very simple to get a link that you can send to your colleagues. Just click the share icon in the top right of the Gleek workspace and the link will be copied to your clipboard. Put this in an email or chat, and the recipient will be able to view the diagram you created.
If you want to download a copy of your diagram so that you can use it in a presentation or document, just click the download icon (it’s right next to the share icon) and you’ll get an SVG image file.
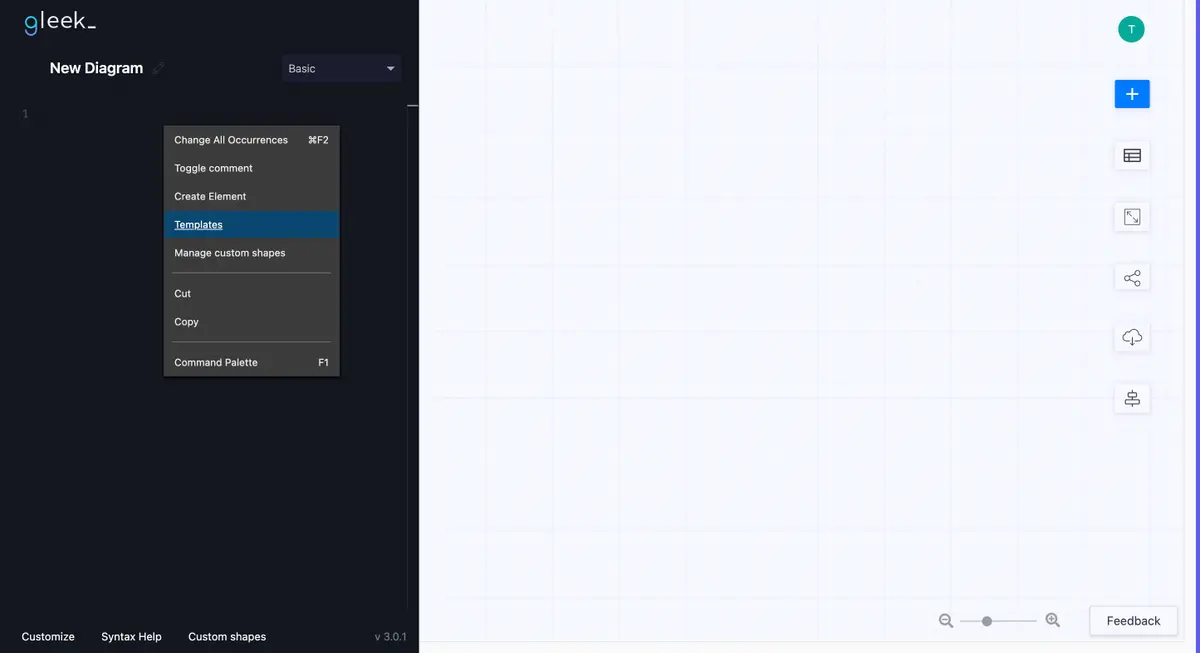
Gleek also has useful prebuilt templates for you to explore. With Gleek open, right-click in the code field and choose Templates. Gleek will automatically fill out the code and draw a diagram. You can then edit or change the diagram whatever way you want.
If you’re ever stuck, check out the Syntax help popup in the bottom-left corner of the app for hints.
What types of diagrams can you build with Gleek?
As you can imagine, you can use Gleek to create lots of handy diagrams. Here are just some of the possibilities:
UML class or object diagram
In the Unified Modeling Language (UML), a class diagram shows the structure of a system. Class diagrams are used when designing object oriented systems and capture the classes, attributes, operations, and relationships between the objects in the system. An object diagram shows the structure of a system at a specific time and describes its behavior.
You can easily show attributes in class and object diagrams in Gleek by using a simple rectangle for the class and listing the attributes inside the diagram using nesting (just hit the tab key to nest anything inside another object).
Tip: For a clear example of how nesting works, use the Template option that we mentioned earlier. Right-click in the code field and select “App diagram”. You can see that the “Conceptual Data Model” and “Physical Data Model” both use nesting.
UML Sequence diagram
Another type of UML diagram that you can make in Gleek is a sequence diagram. Both developers and users depend on these because they are a very straightforward way of modeling interactions between objects in a time sequence. A sequence diagram helps create an overview of how a system works and how all the different parts interact with each other over time, carry out the required actions, and how processes are completed. Sequence diagrams can also be called event diagrams or event scenarios.
A simple example of a real-world interaction that could be represented by a sequence diagram would be a user subscribing to an email service. The diagram would show the sequence of interactions between the user and the email domain over time.
Flowchart
You use flowcharts to represent a process or workflow. You might do this to clarify the steps involved or to help solve problems. To create a problem-solving flowchart in Gleek, use an oval to represent the problem, then use diamonds to show the questions that can be asked to solve the problem. Each diamond leads to a relationship arrow that has either yes or no and a suggested solution. The user follows the flowchart until they find a solution that works.
Concept map
If you want to improve your understanding of any topic, a concept map can help you organize your thoughts. Concept maps are especially easy and fast to create in Gleek. Just start off with an oval for your main concept and add simple rectangles for the rest of the concepts. Connect them with labeled relationships.
Take a look at the second half of this post for a quick tutorial on how you can create a concept map of the solar system in just a couple of minutes in Gleek:
https://www.gleek.io/blog/word-concept-map
Entity relationship diagram
ER diagrams are essential for designing a database and consist of entities, relationships, and attributes. You can represent these in Gleek by using basic rectangles for entities, ovals for attributes, and diamond shapes to describe the relationships. Then you use lines to connect them.
You can read more about ER diagrams in this blog post:
https://www.gleek.io/blog/erd-database-design
System context diagram
This is a high-level diagram that describes the exchange of data between a system and external entities. Start off with an oval to represent your system and then you go on to use relationships to show the flow of data to and from the system.
Check out our blog post on creating a system context diagram here: https://www.gleek.io/blog/system-context-diagram