
What’s life without problems? Probably a little boring, if we’re being honest. If everything were perfect all the time, there would be no challenges, and things would get pretty monotonous. This is a rather optimistic view on what many believe to be an aggravating part of life. No matter how you feel about problems, one thing is true: problems are inevitable. You can’t always control how many problems you encounter in your life, but you can learn better ways to solve them. So, what can we do for those really complex issues that aren’t easily solved? Visual problem solving is the perfect way to see solutions and break down complex issues.
Make your own flowchart with Gleek.
What is visual problem solving?
Visual problem solving is the process of using aids like charts or diagrams to display all the aspects of a problem in order to find viable solutions. When problem solving, sometimes it’s hard to see what’s causing the problem, or other relationships and correlations that are affecting whatever it is you’re working on. Two common methods for problem solving include mind maps and flowcharts. A mind map is a non-linear diagram, used for making new ideas or breaking down complex issues. A flowchart is a linear diagram, used for making action plans and describing processes.
5 steps to solve problems
Identify the true problem
Maybe you know what the issue is in clear terms, or perhaps it’s still a little confusing. A good way to get a concrete vision of the problem you need to solve is to pose it as a question, or a short statement. You might come up with something like ‘our sales have dropped’, or, as a question ‘what can we do to increase sales?’.
Get information
Now that you have a clear objective to solve, the next step is to gather all the relevant information that pertains to the issue. This can look like statistics, comments from customers, employee feedback, and more. Once you’ve collected the data, you’ll need to analyze it from all angles to get a clear view on the topic.
Brainstorming session
Get any and all potential solution ideas out on the table. Doesn’t matter how silly an idea seems, just put anything that comes to mind on the drawing board. This is where your visual aids will really come in handy, especially mind maps. You might need more than one chart, depending on how complicated the issue is.
Choose the best idea(s)
Whether on your own or with a team, you’ll have to eliminate the potential solutions that just won’t work. To find the solution that’ll work best, it’s good to analyze it in the same way you did the problem – by looking at potential outcomes, and all facets involved.
Make an action plan
So you think you’ve found the perfect solution! Now what? If your problem is complicated, usually the solution will be too. Here is where another visual aid, like a flowchart, will be helpful. Map out the specific steps you need in order to implement your solution. Then, it’s time to put your plan into action.
These are just the basic steps you can use to start problem solving. You may find that other actions are needed during your own journey.
Common mistakes when problem solving
Mistakes? We all make them from time to time. Here are some common mistakes we are prone to when trying to fix problems.
Undefined problem – When identifying the problem, it’s possible that the problem is too big, multi-faceted, or too complex to tackle all at once. A way to avoid this is to break the problem down into chunks, following common themes.
More problems arise – This isn’t always a direct result of anything we do, but it can happen nonetheless. The best way to deal with more problems that arise when you’re trying to solve the original one is to think of the possible things that could go wrong during the solution stage. When you’re prepared for any situation, you’ll rarely have any setbacks.
No action plan – Finding a way to solve your problem doesn’t mean that the planning is over. On the contrary, you need to create a strategy to properly execute your solution so you won’t end up with a half-solved problem and even more issues than you started with.
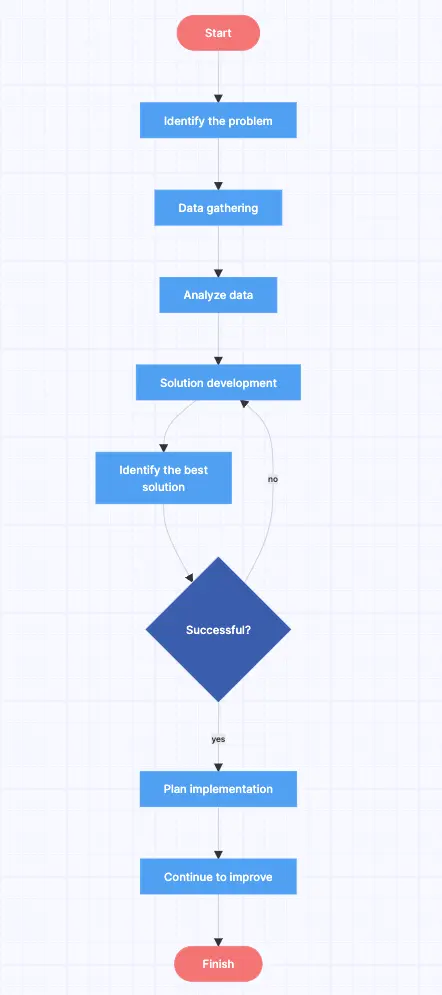
When to use flowcharts
One way to chart your problems and progress is through flowcharts. For those who like to think in a step-by-step or linear fashion, flowcharts are the best way to visualize things. Let’s have a look at some situations that are best suited to flowcharts.
Big problems – Flowcharts can help break down a large problem or solution into specific steps or stages from start to finish.
Decision trees – This type of flowchart is helpful when diagramming actions that will happen as a result of other actions, whether they be in a software system or actions taken by people.
Cause and effect – Similar to a decision tree, a cause and effect flowchart is where you can analyze the potential results of various actions, past or present.
Make your own flowchart with Gleek.
Check out our 20 flowchart templates that you can also easily edit!
When to use mind maps
Mind maps are great for brainstorming sessions, and non-linear problem solving. Here are some situations that are best visualized through a mind map.
Finding the problem – So, what is the problem exactly? Sometimes it’s hard to see. Making a mind map offers you the opportunity to see all the moving parts involved with a situation, and how they relate to one another, and can help you suss out the true problem.
Core and branching ideas – You start with a core idea, such as ‘online sales’, then add related ideas or issues branching off from that, like maybe ‘ad revenue’, or ‘social media campaigns’. Then those ideas can have their own branches. This is an easy way to analyze all aspects of a problem.
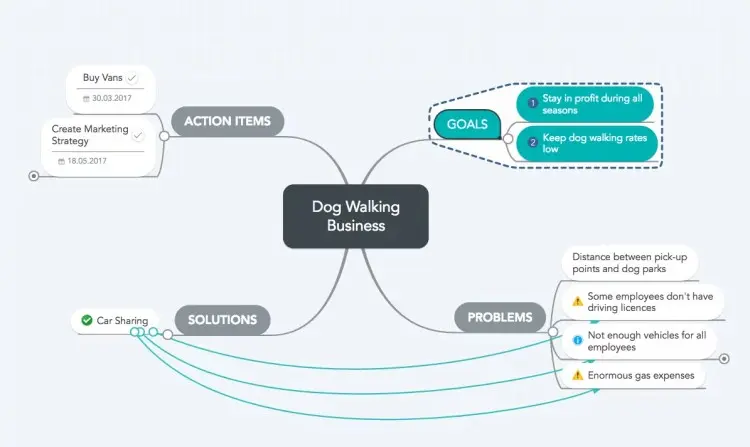
Source: Problem Solving with Mind Maps (Tutorial)
Looking to create your own flowchart? Gleek has the solution for you. With Gleek, you can create your own flowcharts using a text-based command center, without ever using your mouse. Not only can you create flowcharts, you can create many other UML-based diagrams that will wow your colleagues and bring new life to your presentations. Get started for free today.
Related posts
Uses for cross-functional flowcharts
20 editable flowchart templates & examples
Process Maps vs. Flowcharts: An in-depth analysis
How to Use Flowcharts for Problem Solving
Flowcharts for Decision-Making: Visualizing Options and Risks
What are flowchart symbols? Here’s a handy guide with examples
A step-by-step guide to creating a flowchart in Google Docs
7 stages of the product development process (flowchart example)