
What is data modeling?
Data modeling is a way of creating a blueprint, often an actual diagram, for the design of a data storage system. It clearly shows the data types to be stored, how they relate to each other, and the rules that are needed for the system to operate. Check out this Gleek article on data modeling if you want a more detailed explanation, including a rundown of the types and the process involved.
Why is data modeling important?
Before creating any new software or application, a good engineer will take the time to plan out the elements to be included and analyze how they work together. The data model acts as a form of documentation that can be used when designing the system, so that potential problems are identified early in the process. It can also be referred to later in the life of the system to solve issues. Most importantly, it communicates the structure of the system to all stakeholders so that they can make sure that their needs are being met.
Make your own ER diagram in Gleek.
Tips for better data modeling
As with any technique for documenting a workflow, process, or system, data modeling needs to begin with an analysis of what is to be modeled. You must have a deep understanding of both the business needs that are to be met and the data to be processed. This will inevitably involve meeting with stakeholders, discussing their needs and those of the business, and making sure that there are no hidden requirements that will emerge later on in the design process.
Data modeling does not necessarily involve using a diagram, but a visual representation of the data is a smart, efficient way to make sure that all the elements have been taken into account and the connections between them are fully understood.
The data model can be detailed, but it is sensible to make sure that it is not overwhelmed by irrelevant detail. It’s useful to take a step back at the early stages and decide whether every element really needs to be in there. If you end up with a dataset that’s too big, your queries will be commensurately slower, so only include data types that are essential.
Finally, as you create your data model, make sure that you have checked it at each step. As you go from the conceptual, to the logical, and ultimately the physical stage, you should have confirmed that it all hangs together correctly. It’s easier to correct errors at the conceptual stage than when you’re dealing with the columns, tables, and keys at the physical stage.
What are some data modeling techniques and tools?
If you’re just getting started with data modeling, there are three different approaches you should experiment with. Two are highly visual, while the third is useful for added detail and can be combined with either of the others.
UML class diagram
Class diagrams are great for working out the design of a system at the conceptual stage. They use a visual diagramming language called Unified Modeling Language (UML) to represent the elements of the data model. UML is a well-recognized tool that enables a designer to take advantage of standardized notation and guidelines when creating a class diagram. This makes it easier to share your diagram with colleagues and collaborate on changes.
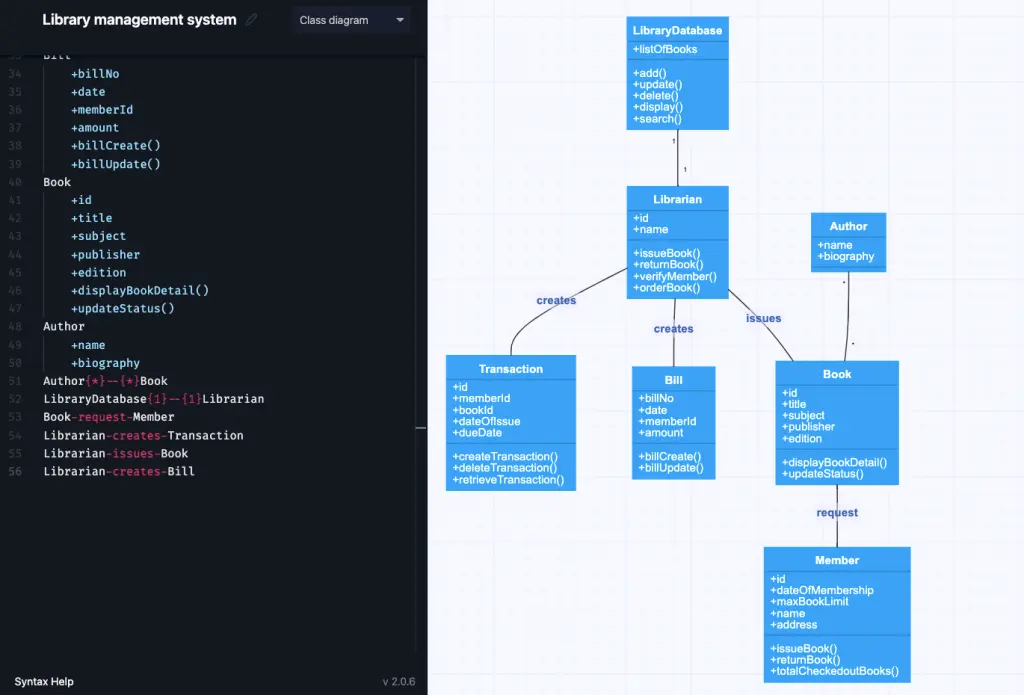
Source: Class diagram of library management system
The elements represented in a class diagram are classes, attributes, methods, and their relationships to each other. The classes are the basic elements of the diagram. These are the objects in the system that share similar roles. A class can in turn have none or many attributes. The attributes are the characteristics of these classes, or the data definition for the class. They describe the instance of the class and the structure or value of that instance. Each attribute usually has a value. Methods, or operations, are the actions, or functions, that the class will have to perform in the system. This usually involves communicating with other classes. In many cases, it is optimal to have each method perform only a single action.
Make your own diagram with Gleek.
Entity-relationship (ER) diagram
An entity-relationship (ER) diagram, or ERD, is also ideal for designing at the conceptual level. ER diagrams are really fast to create and easy to understand, so in many ways they can be great for explaining your ideas and designs to less technical colleagues. But the entity-relationship diagram can just as easily be used for the logical and physical stages of data modeling.

Source: Entity-relationship diagram example, Crow’s foot notation
A conceptual ERD consists of three elements: entities, relationships, and attributes. Like UML, entity-relationship diagrams have a standardized approach to representing the elements in the system. In fact, there are two most common ways to draw ERDs: Chen notation and Crow’s Foot.
In both Chen and Crow’s Foot, entities are depicted as a rectangle and attributes as ovals connected to the entity they belong to. In Chen, labelled diamonds act as the relationships between the entities. In Crow’s Foot, the relationships are simply a labelled line. Each method of notation uses symbols to represent cardinality. Check out these two Gleek videos if you want to find out more about Crow’s Foot notation or Chen notation.
Make your own ER diagram in Gleek.
ER diagrams are good for designing relational databases, or a collection of data items with pre-defined relationships and organized as tables with columns and rows.
Data dictionary
A data dictionary is a non-visual way to describe a data model. It uses a straightforward tabular representation of data and is basically an inventory of the tables and columns to be used in the system.
At its core, the data dictionary lists the data sets, or tables, and lists the attributes, or columns of each table. It can also include descriptions of the items, explanations of the relationships between the tables and columns, and can get into the detail of constraints, uniqueness, default values, or calculated columns.
You can use a data dictionary as a supplement for either an ER or class diagram, to give a more detailed account of the elements involved in the system, and to keep track of conventions, rules, and specifications. A diagramming tool like Gleek is perfect for creating both UML class diagrams and ER diagrams and includes useful templates to get you started on data modeling right away!
Related posts
The logical data model explained
4 Key principles of effective database design
Improving your database skills with many-to-many relationship examples
What is the entity-relationship diagram in database design?
What is data modeling? Types & process
Exploring One-to-Many Relationship Examples in Databases
Quick guide to physical data modeling
How do you convert an ER diagram into a relational schema?