
In project management, there are few tools as effective and illuminating as the Gantt chart. This simple yet powerful visual tool is invaluable for anyone overseeing a complex task, including research project proposals. It is particularly beneficial in the early stages of a project, where meticulous planning is required to ensure that all elements of the project are understood, accounted for, and scheduled appropriately. Therefore, whether you're an academic researcher, a project manager in a corporate setting, or even a student planning your thesis, understanding how to create and use a Gantt chart can be a significant asset.
What is a Gantt Chart and what is it used for?
A Gantt chart, named after its creator, Henry Gantt, an American mechanical engineer and management consultant, is a type of bar chart that visually represents a project schedule. It was first developed in the early 20th century and has since become a staple in project management across various fields and industries. Today, it's used by project managers in sectors like construction, software development, research and development, and more.
At its core, a Gantt chart consists of two main components: tasks and time. The tasks related to the project are listed on the vertical axis, while the horizontal axis represents time. Each task is represented by a horizontal bar, the length of which corresponds to the duration of the task.
Make your own Gantt chart in Gleek.
Gantt charts are incredibly useful for planning and scheduling projects, tracking progress, and managing dependencies between tasks. They provide a clear visualization of the project timeline and help to identify potential bottlenecks and overlaps. This makes them an ideal tool for coordinating teams, allocating resources, and keeping stakeholders informed.
The versatility of Gantt charts solves numerous problems faced by project managers. They simplify complex projects by breaking them down into manageable tasks and visualizing their sequence and duration. This can help in avoiding over-scheduling, underestimating deadlines, and mismanaging resources.
Whether you're a seasoned project manager or a student working on a research proposal, mastering the use of Gantt charts can significantly streamline your project planning process and enhance your team's productivity.
Components needed for Research project proposal diagram
Creating an effective research project proposal diagram requires several key components. These elements provide a comprehensive overview of the project, including its timeline, tasks, and significant milestones.
Project Stages: Each stage of your research project should be clearly defined. This can include the literature review, methodology development, data collection and analysis, results compilation, proposal drafting, peer review, and final edits.
Timeline: The timeline provides a visual representation of the project's duration. It should outline the start and end dates of the project, as well as the estimated completion time for each stage.
Tasks: Each task within the project stages should be clearly outlined. This includes what needs to be done, who is responsible for it, and when it should be completed.
Milestones: Milestones mark significant achievements or phases in your project. These can help track progress and ensure that the project is moving forward as planned.
Dependencies: Dependencies show the relationship between different tasks. It's crucial to highlight how the delay in one task can impact others.
Status: The status of each task and stage helps monitor the project's progress. It can indicate whether a stage is completed, in progress, or yet to start.
Notes/Comments: Any additional information, observations, or feedback about the project can be included here. This could be insights gained during the research, changes made to the project plan, or issues that have arisen.
By incorporating these components into your diagram, you can create a well-structured, transparent, and efficient project proposal.
Creating a Research project proposal Gantt chart using the Gleek App
Step 1: Launching Gleek and Selecting 'New Diagram'
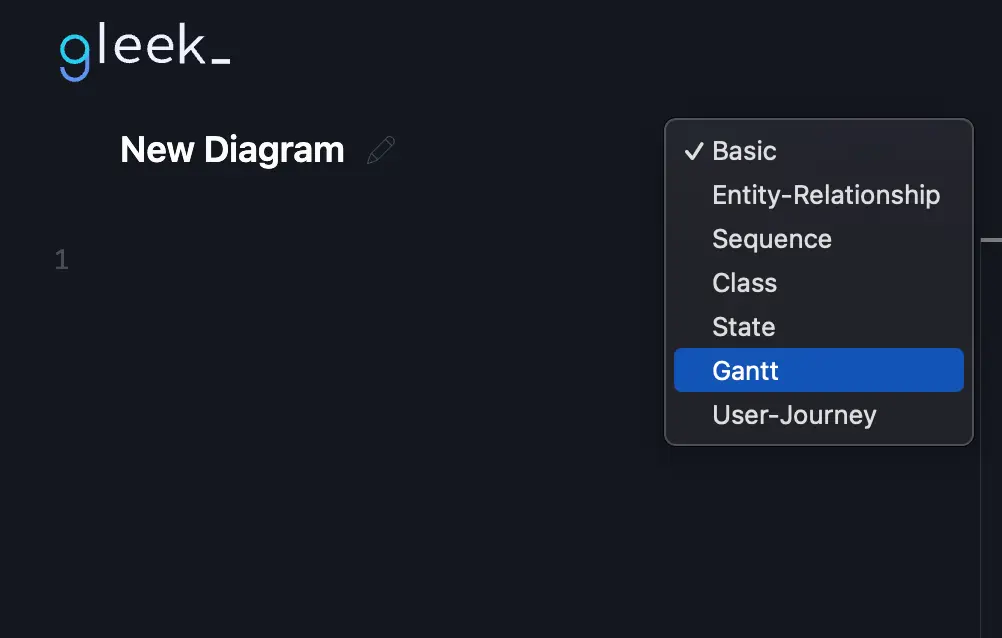
First, launch Gleek.io in your web browser. Once you're in, select 'New Diagram' from the options available. In the diagram type, choose 'Gantt'.
Step 2: Defining Research Goals
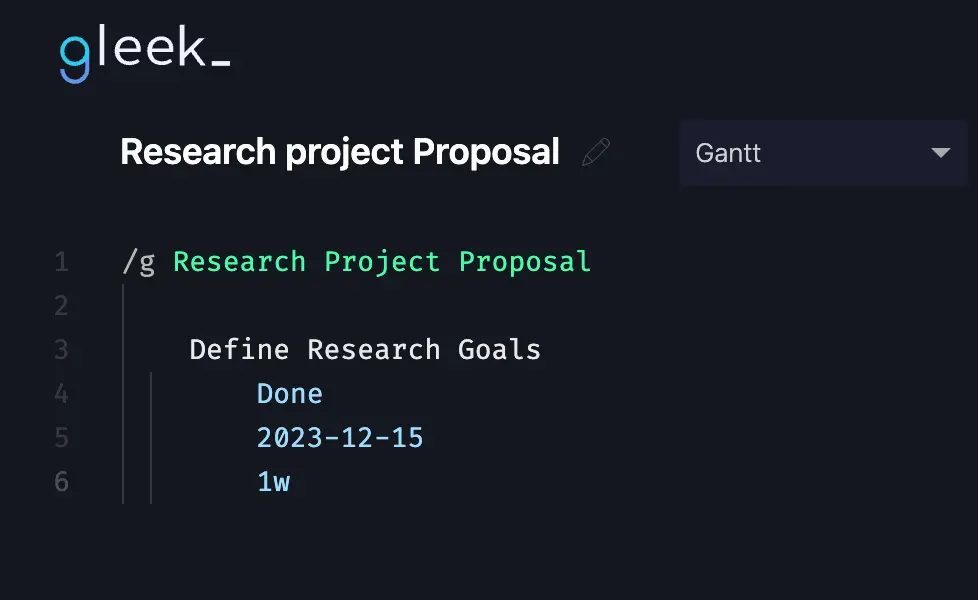
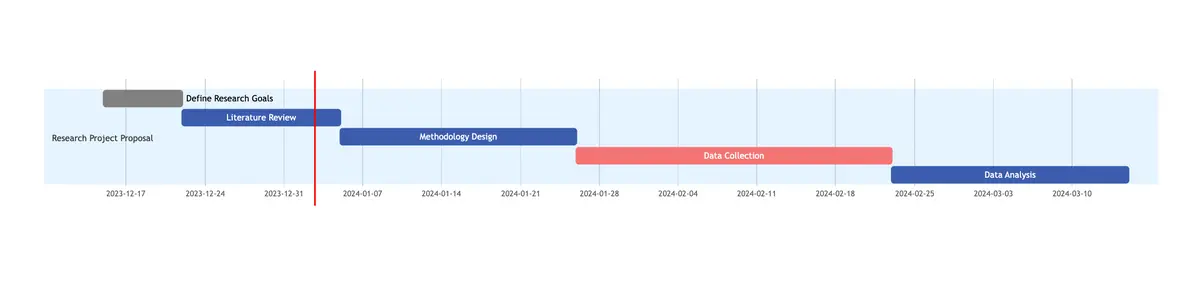
The research project initiates with an active phase dedicated to defining research goals, which commenced on December 15, 2023, lasting for a week. This phase involves brainstorming, outlining objectives, and establishing the research's overarching scope.
Step 3: Literature Review Phase
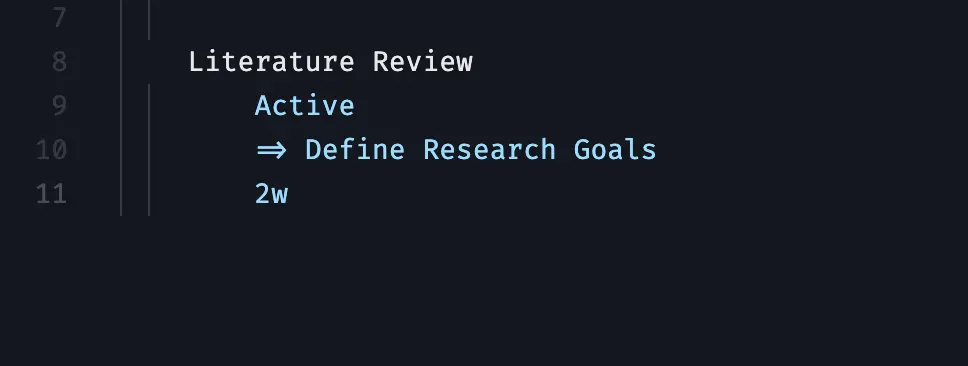
Transitioning to the next stage, we have the completed 'Literature Review' phase spanning two weeks. This phase entails an in-depth analysis, sourcing relevant publications, synthesizing existing knowledge, and aligning it with the predefined research goals.
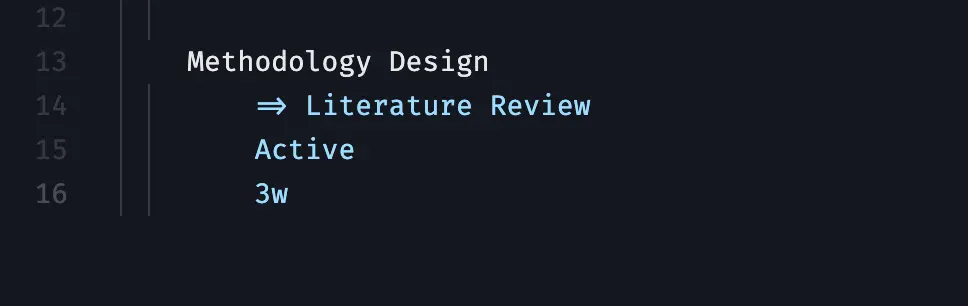
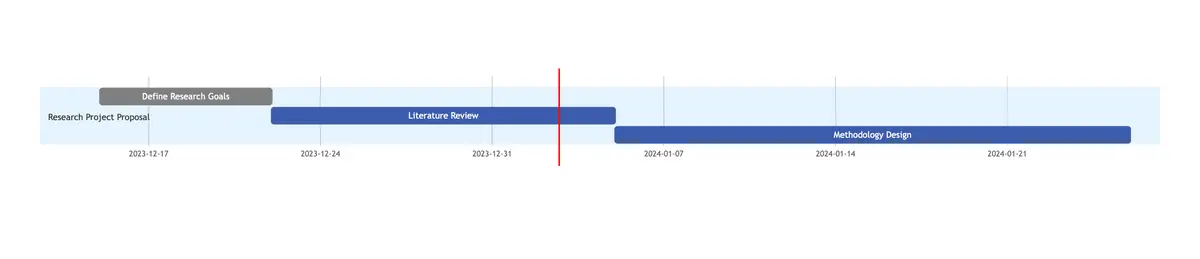
Step 4: Methodology Design Phase
Progressing to the 'Methodology Design' phase, currently active for three weeks, this stage intricately structures the research approach. It involves designing methodologies, frameworks, and strategies based on insights gleaned from the literature review, ensuring a robust research plan.
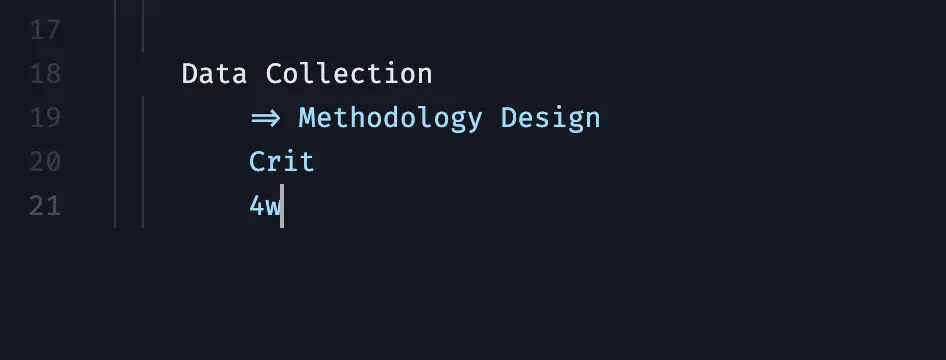
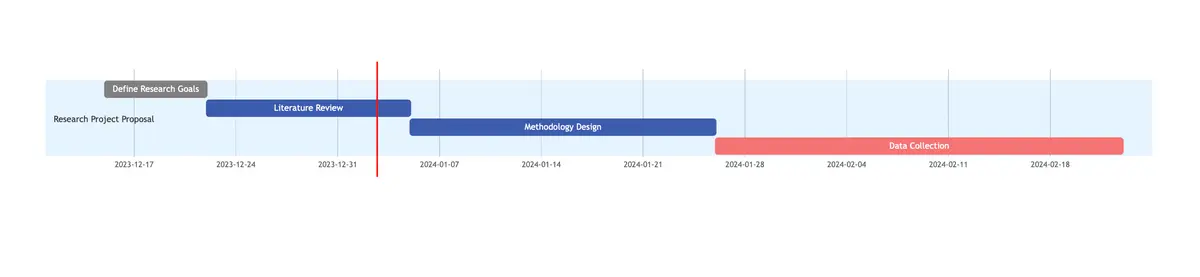
Step 5: Data Collection Phase
Following the planning stages is the critical 'Data Collection' phase, slated for four weeks. This phase involves meticulously gathering and assembling primary data, employing various methodologies such as surveys, experiments, or interviews, aligning with the established research framework.
Step 6: Data Analysis Phase
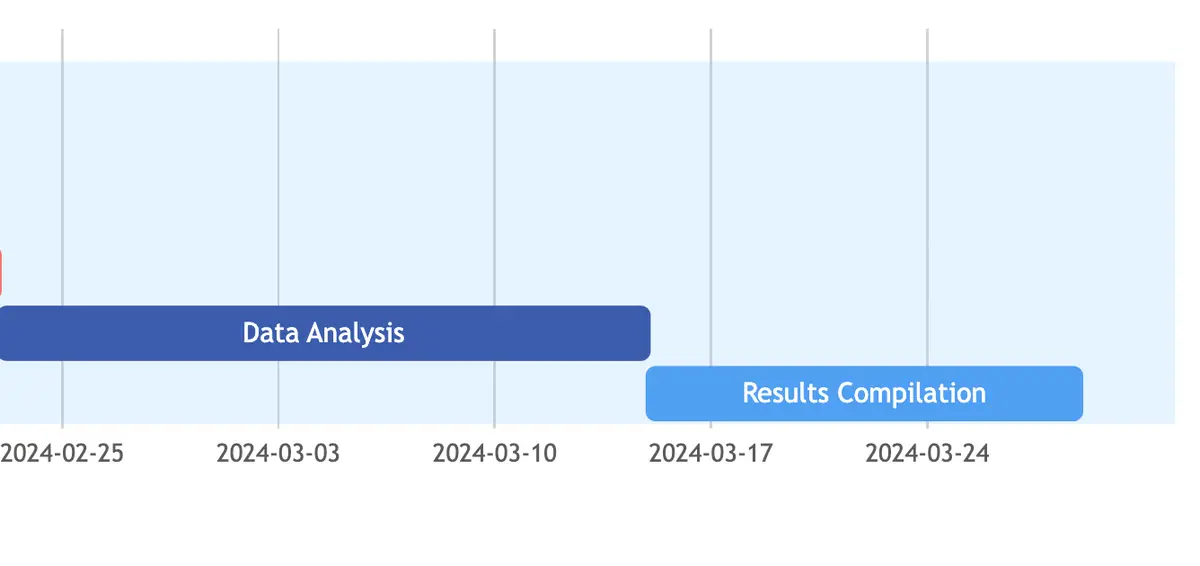
Post-data collection, the active 'Data Analysis' phase spans three weeks. This phase engages in thorough data examination, statistical analysis, and deriving insights from the accumulated information. It involves identifying patterns, correlations, or trends relevant to the research objectives.
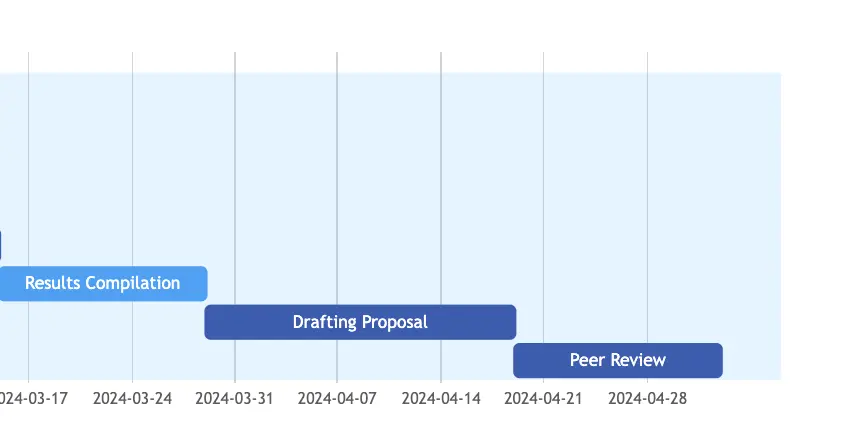
Step 7: Results Compilation Phase
Subsequently, the 'Results Compilation' phase consolidates and organizes the analyzed data over two weeks, presenting it in a coherent format. This phase involves preparing comprehensive reports, graphs, or summaries, showcasing the findings derived from the data analysis stage.
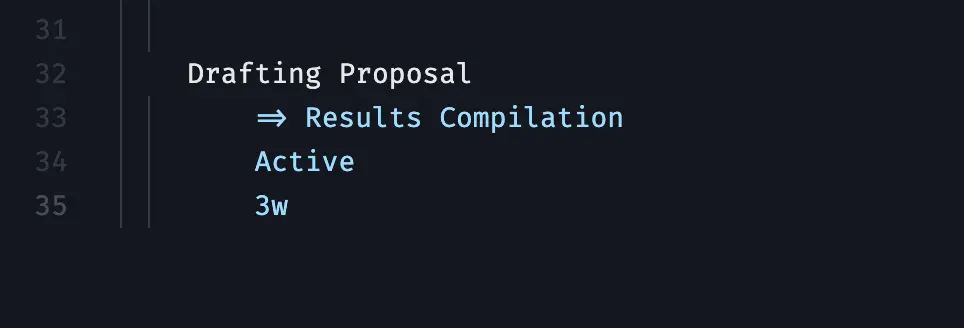
Step 8: Drafting Proposal Phase
Advancing further, the active 'Drafting Proposal' phase, extending over three weeks, involves crafting the research proposal. It includes outlining the research problem, detailing methodologies, and structuring a cohesive proposal aligned with the project's objectives.
Step 9: Peer Review Phase
Upon completion of the draft, the two-week 'Peer Review' phase gathers insights and constructive feedback from peers or subject experts. It involves peer evaluations, discussions, and recommendations aimed at refining and enhancing the proposal's quality.
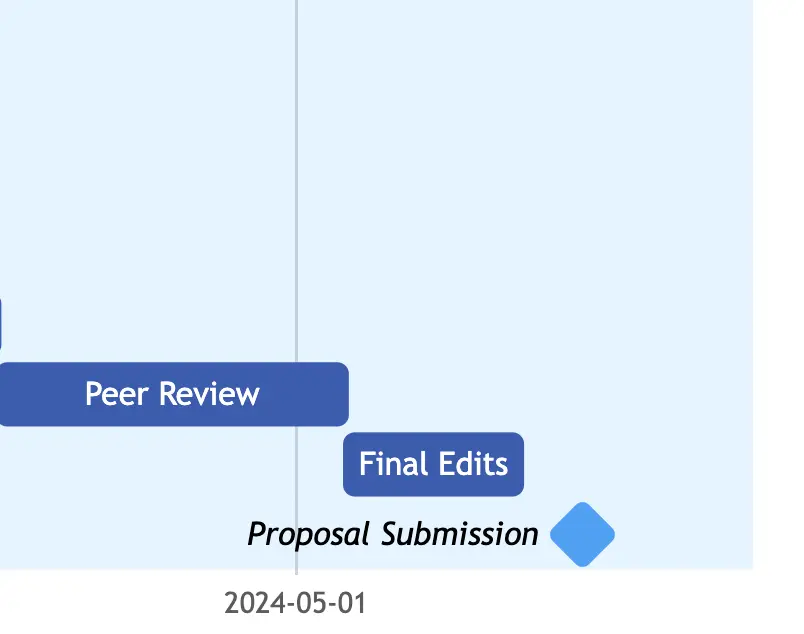
Step 10: Final Edits
Finally, the one-week active 'Final Edits' phase focuses on meticulous revisions, addressing feedback, and ensuring the proposal's completeness, accuracy, and compliance with set standards. This stage includes proofreading, formatting, and polishing the final document.

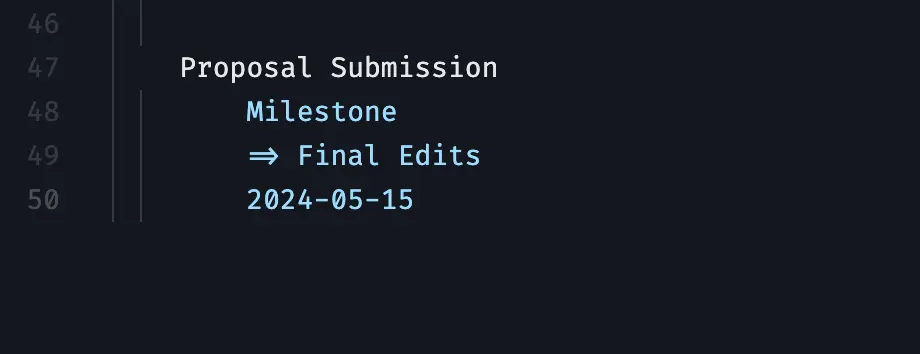
Step 11: Proposal Submission Milestone
The 'Proposal Submission' milestone, set for May 15, 2024, marks the conclusive stage, signifying the submission of the crafted and refined research proposal for evaluation and potential implementation.
Hurray, You Did It!
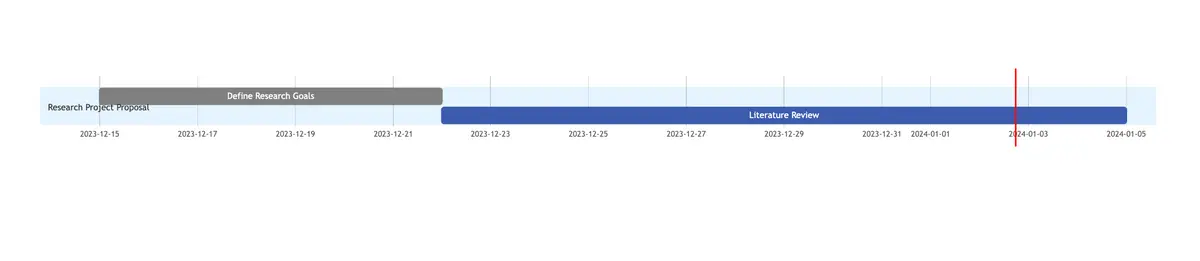
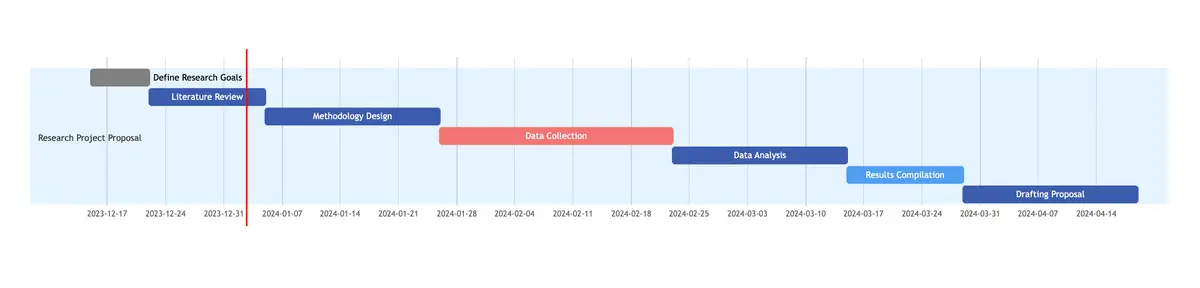
And there you have it! Your Research Project Proposal Gantt Chart is now complete.
Make your own Gantt chart in Gleek.
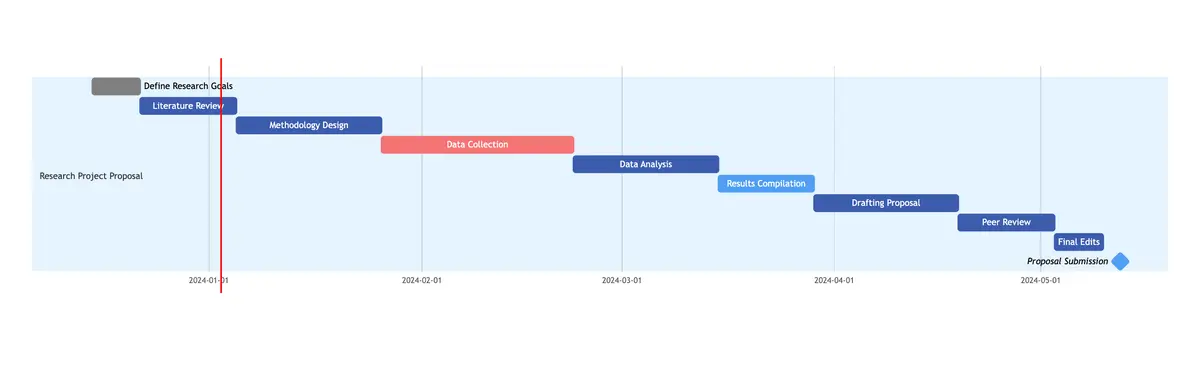
This comprehensive diagram, with its clearly defined stages, tasks, timeline, dependencies, resources, and status, provides a holistic view of your research project. It not only serves as a visual representation of the entire project but also acts as a roadmap guiding you from the initial brainstorming phase to the final proposal submission.
Utilizing such a diagram can greatly enhance your project planning and execution, ensuring all aspects are considered, dependencies are taken into account, and milestones are tracked. It fosters better coordination, communication, and understanding among team members, leading to more efficient and effective project management.
About Gleek.io
Gleek.io is a powerful tool that can further enrich your project planning needs. It's an intuitive app designed to help you visualize complex ideas, processes, and systems through various types of diagrams. Whether you need to create a flowchart, UML diagram, or even a Gantt chart like the one we've just built, Gleek.io makes the process straightforward and hassle-free.
With its keyboard-centric approach, Gleek.io allows you to create diagrams faster than traditional drag-and-drop tools. You can quickly jot down your ideas and see them evolve into structured diagrams in real-time, making it an ideal tool for brainstorming sessions, project planning, and presentations.
In conclusion, Gleek.io is more than just a diagramming tool. It's a platform that enables you to visualize your thoughts, communicate complex ideas simply, and manage your projects more effectively. Give it a try for your next project and experience the difference it can make!
Related posts
Beyond Traditional Planning: Top Gantt Chart Alternatives in 2024
Gantt chart critical path explained
Visual project management: Gantt Charts vs. Timelines explained