
In this article, we will learn how to create a state diagram for the student registration process using the Gleek app. The Gleek app is an intuitive tool that allows us to visually model our ideas and processes in a simple and efficient manner. It's a perfect tool for anyone looking to understand complex systems or design new ones.
State diagrams, also known as state machine diagrams or state chart diagrams, are very useful in visualizing the different states of an object throughout its lifespan. They are particularly beneficial in understanding and designing complex systems such as the student registration process.
What do you need to know about State diagrams?
State diagrams are part of the Unified Modeling Language (UML), a standard language for specifying, visualizing, constructing, and documenting the artifacts of software systems. They depict the behavior of a system, showing a sequence of states an object goes through during its lifetime in response to events, along with its responses to those events.
Components of a State Diagram
A UML state diagram has several key components:
States: The conditions during the life of an object. These states represent the performance of an activity or simply waiting for an event.
Transitions: The movement from one state to another. Transitions are triggered by the completion of the activities or events.
Events: The occurrences that trigger the transitions from one state to another.
Initial and Final States: The initial state is the state of an object before any events occur and the final state signifies the end of the object's lifespan.
Learn more about the power of State diagram in our recent blog post: State Diagram for Payroll System
Uses of a State Diagram
State diagrams are used to model dynamic behavior of a system, they can help:
Visualize the sequence of states an object goes through during its lifespan.
Understand the complex logic of a system by simplifying it into states and transitions.
Design and analyze the behavior of an object from its creation to its termination.
Who uses State Diagrams?
State diagrams are used by software engineers, system designers, business process modelers, and other professionals involved in systems design and analysis. They are particularly useful in fields like software engineering, business process modeling, and data flow diagramming.
Create your own state diagram.
In the next section, we will explore how to use the Gleek app to create a state diagram for a student registration process.
The Components Needed for the Student Registration Process
Creating a state diagram for the student registration process with Gleek involves several key components. Each of these plays a crucial role in accurately representing the process and ensuring the diagram is clear, efficient, and precise.
1. Start and End Symbol:
The start and end symbols [O] are used to denote the beginning and conclusion of the registration process. They provide a clear indication of the process's lifecycle and help viewers understand the flow from start to finish.
2. States:
States represent specific stages in the registration process. For example, 'Start Registration' and 'CompleteRegistration' are states. They are essential as they outline each step students must take to complete their registration.
3. Composite State:
A composite state like 'Idle' groups several related processes together. This is beneficial for simplifying complex processes by breaking them down into more manageable sub-processes.
4. Choice:
The choice component is used to represent decision points within the process. In our case, students must choose between 'Regular Course Registration' and 'Online Course Registration.' This component helps to illustrate the different paths a process can take based on certain decisions.
5. Concurrent Paths:
Concurrent paths are used to show how different processes can occur simultaneously. By illustrating both 'Regular Course Registration' and 'Online Course Registration' concurrently, we can accurately represent the various options available to students.
6. Transitions:
Transitions are represented by arrows and indicate the progression from one state to another. They are crucial for demonstrating the flow of the process and showing how each state connects to the next.
Related post: Class diagram for a University management system
By understanding and utilizing these components effectively, you can create a clear, concise, and precise state diagram for the student registration process. This will not only help to streamline the registration process but also provide a comprehensive visual representation of how each stage connects to the next.
State Diagram for the Student Registration Process using Gleek
Creating a state diagram with Gleek is quite straightforward. Let's walk through the process of creating a state diagram for the Student Registration Process.
Create your own state diagram.
Step 1: Launch Gleek App
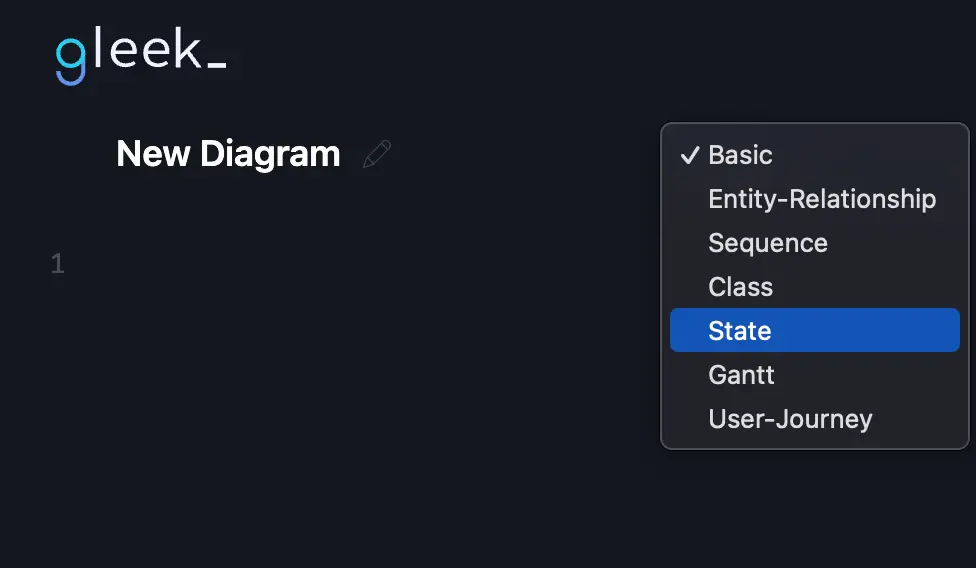
Launch the Gleek app in your web browser by typing https://app.gleek.io/ into your address bar. Ensure you are logged in. Click on 'New Diagram,' select 'State' from the dropdown, and get started.
Step 2: Initiate the Process
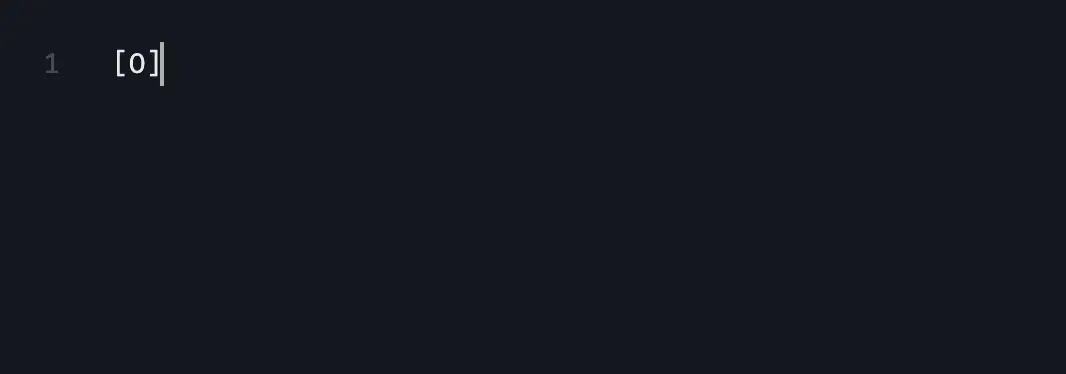
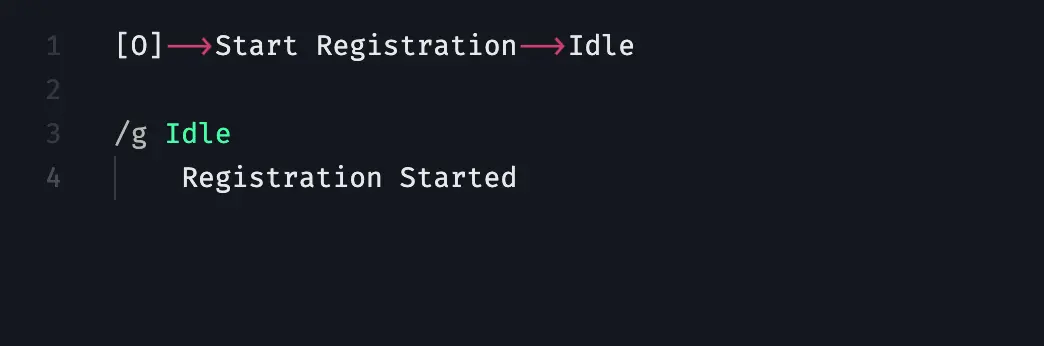
Start by illustrating the beginning of the process. Inside square brackets, type an 'O' to signify the start of this journey.
Step 3: Define the First State
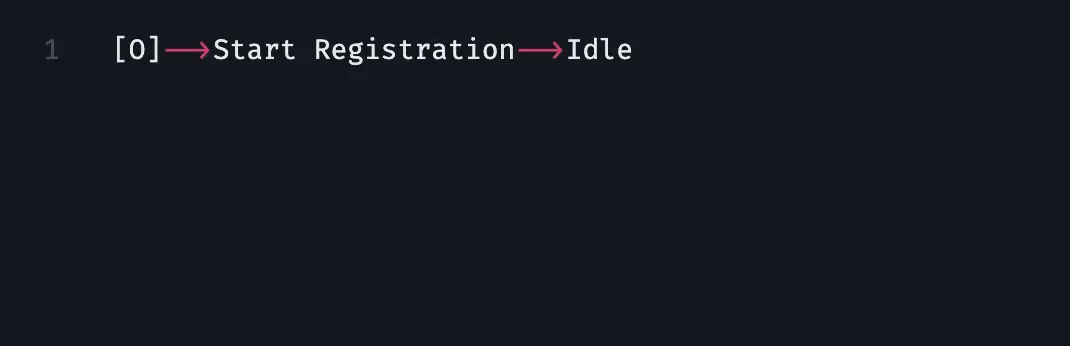
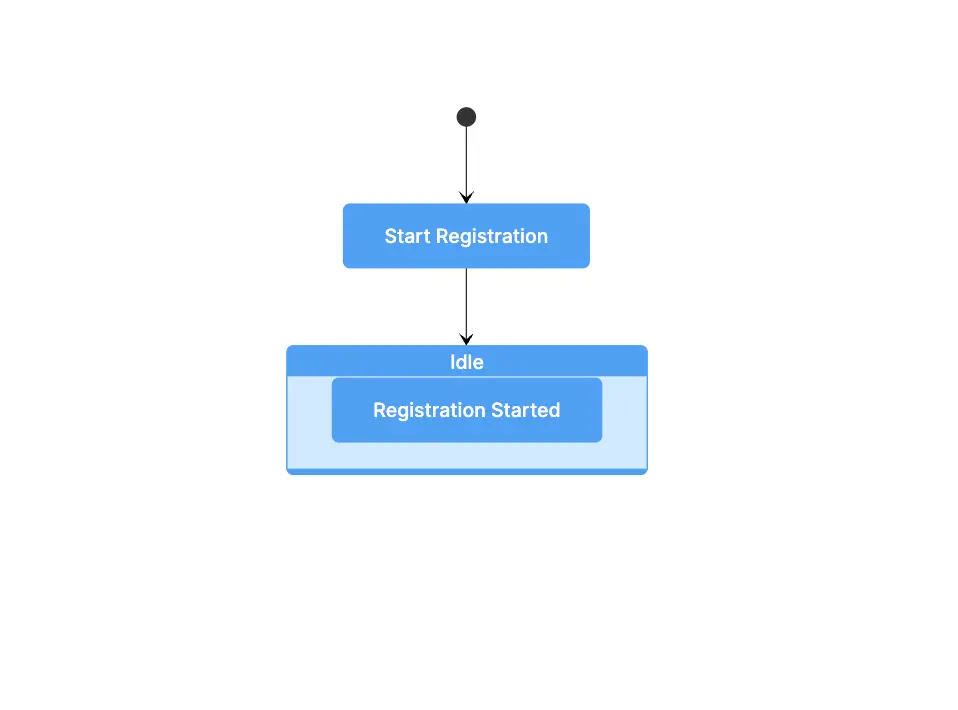
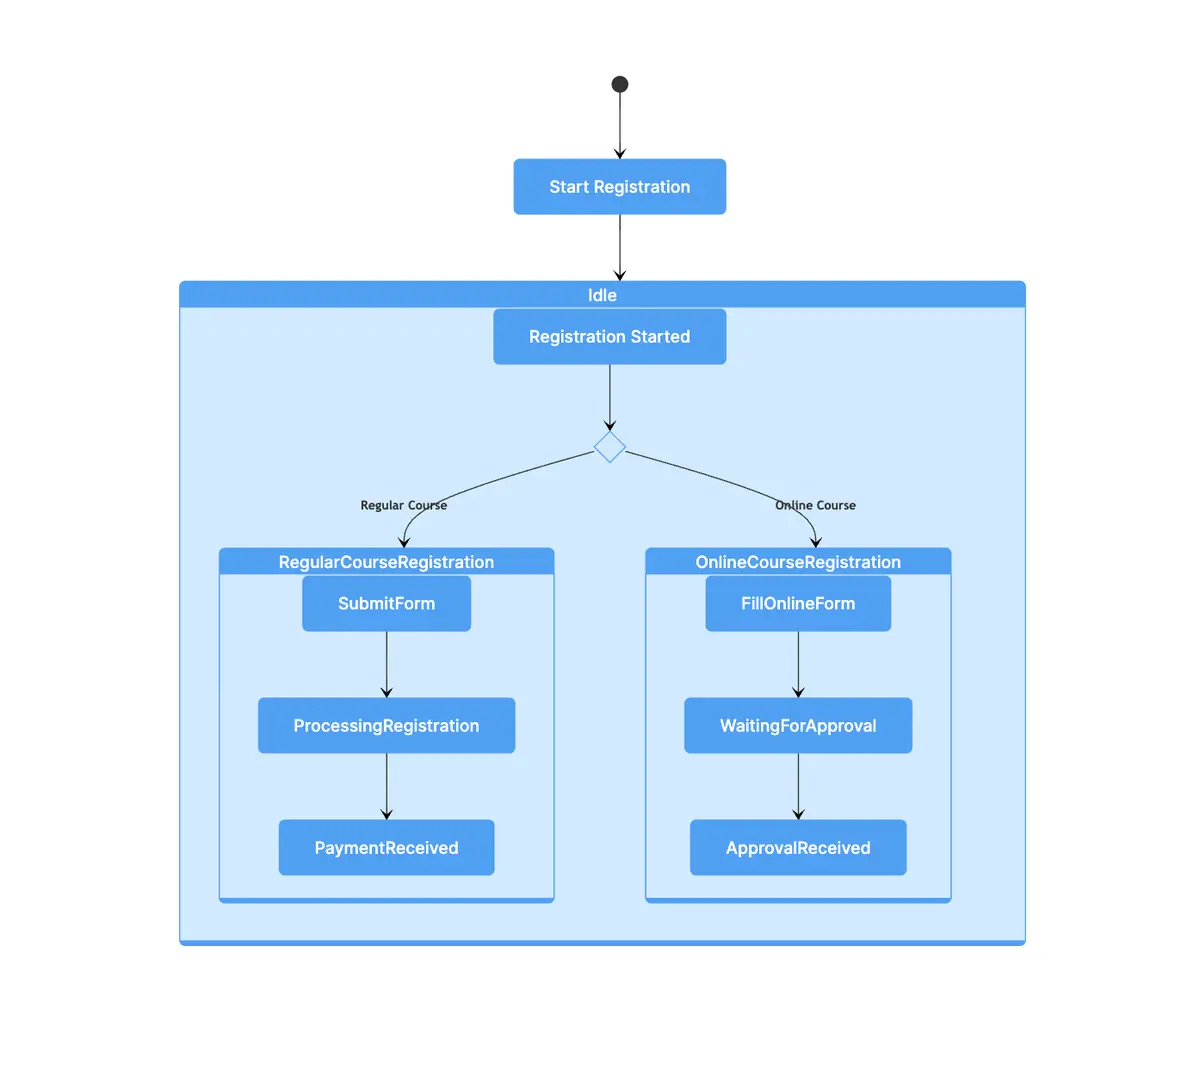
The journey begins at the 'Start Registration' state. Connect the start symbol to this state using an arrow (-->). As the process commences, students initiate their registration and transition into the 'Idle' state. Connect 'Idle' to 'Start Registration' with another arrow.
Step 4: Create the Composite State
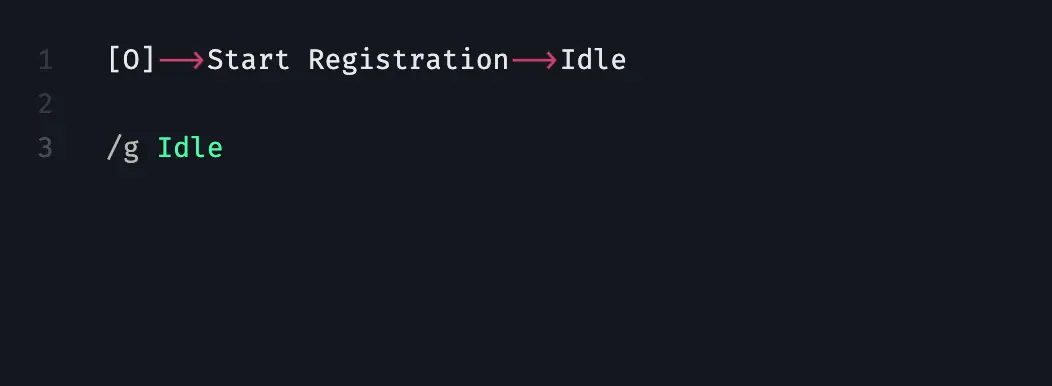
In our diagram, 'Idle' represents a composite state. To translate this into Gleek syntax, input a slash (/), followed by 'g', and then 'Idle'.
Step 5: Detail the Processes
Now, delineate the processes under this composite state. Start a new line, hit TAB and type "Registration Started" to denote the process's inception.
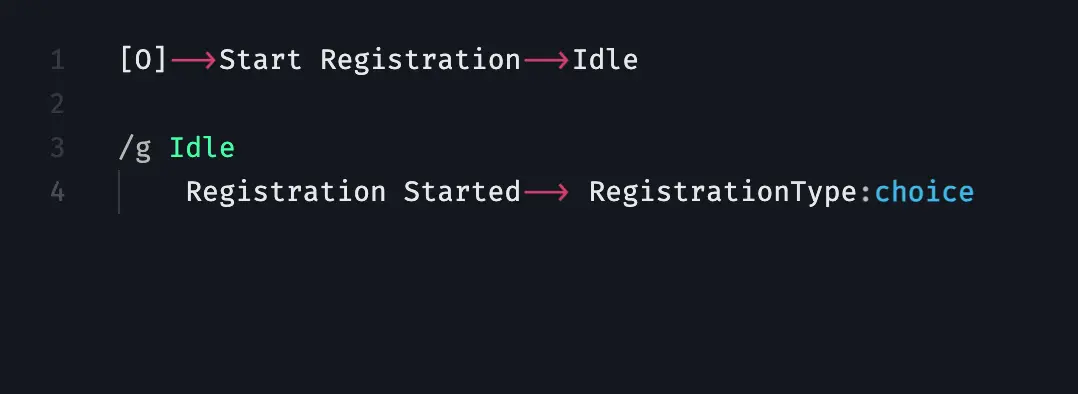
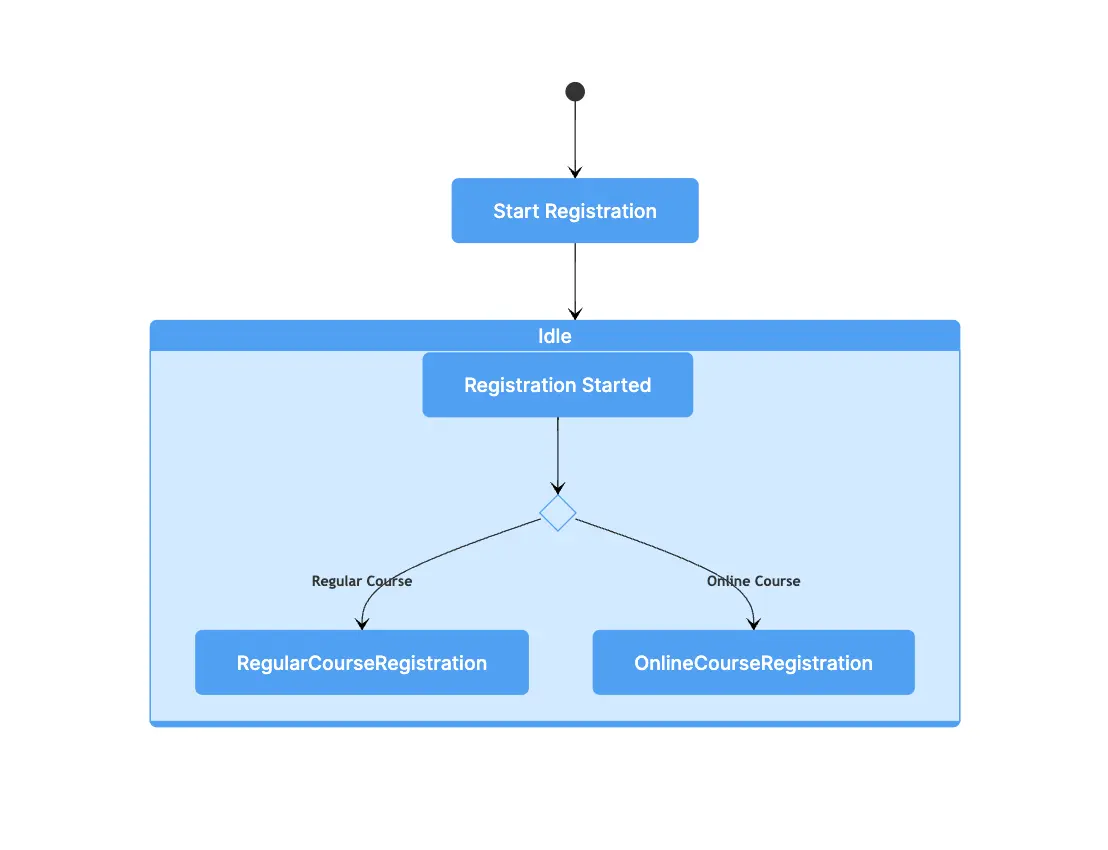
Step 6: Create a Decision Point
As students begin the registration process, they encounter a critical decision point: selecting the course type for registration. Create this choice by adding an arrow after the "Registration Started" state, typing "RegistrationType" followed by two dots and 'choice'.
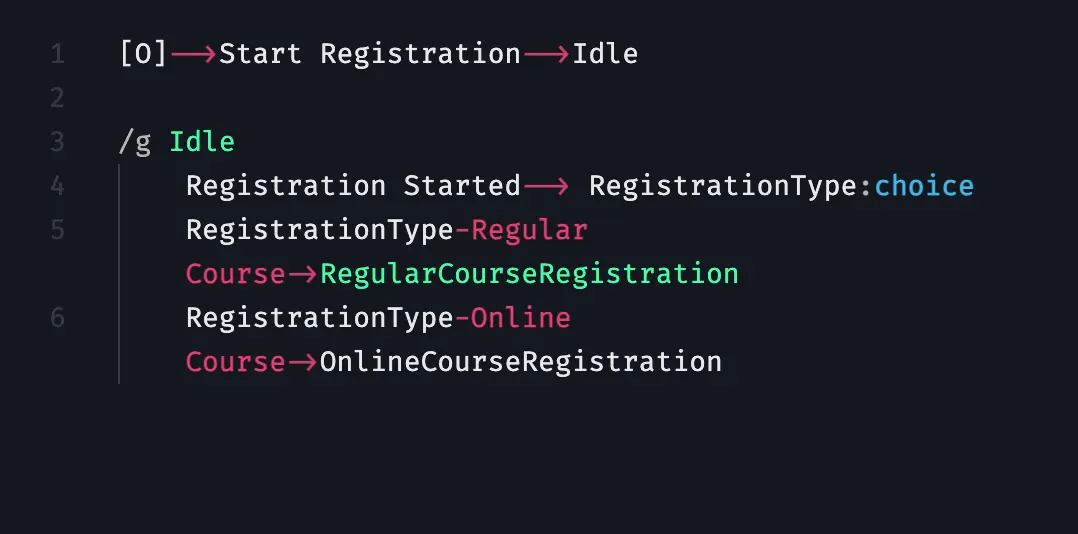
Step 7: Define Concurrent Paths
This choice leads to two concurrent paths: 'Regular Course Registration' and 'Online Course Registration.' Connect 'RegistrationType' to 'RegularCourseRegistration' using a dash-arrow sequence labeled as 'Regular Course'. Additionally, connect 'RegistrationType' to 'OnlineCourseRegistration' by indicating 'Online Course' within the arrow.
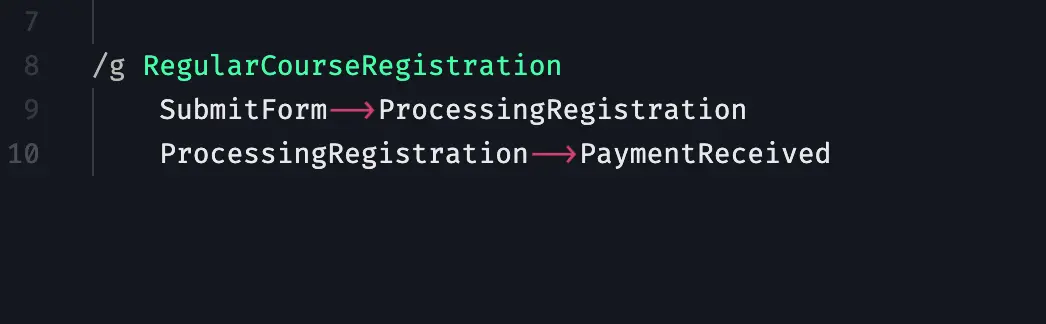
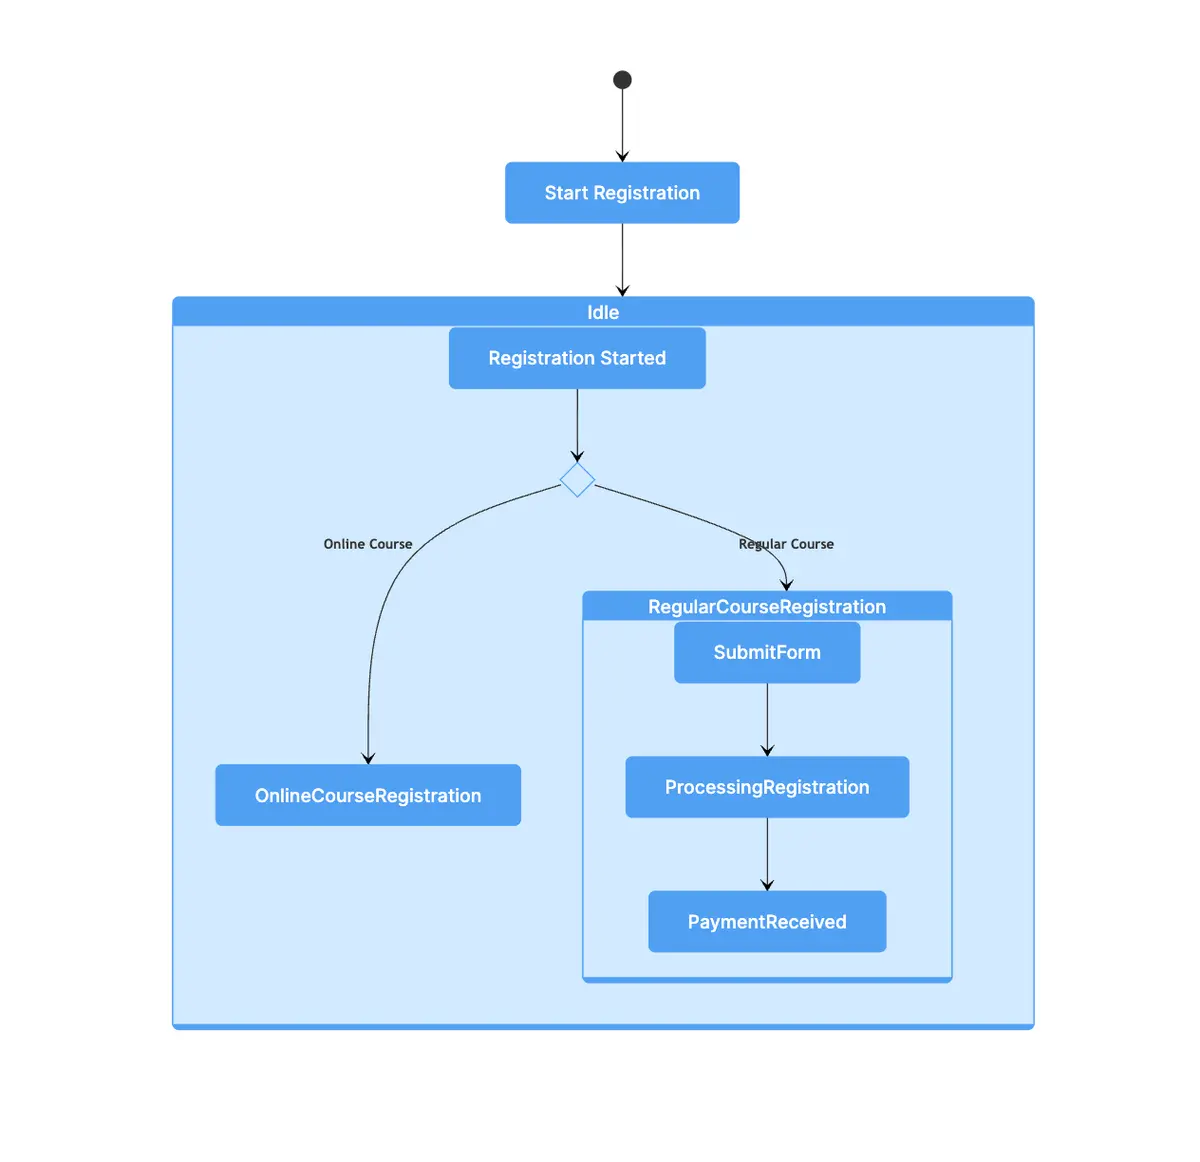
Step 8: Detail the Concurrent States
Detail each track individually. For 'Regular Course Registration', students submit their registration form, initiating the system's verification phase. Indicate 'SubmitForm' on a new line, followed by an arrow leading to 'ProcessingRegistration'. The culmination involves students making the course payment, concluding this flow with 'Payment received'.
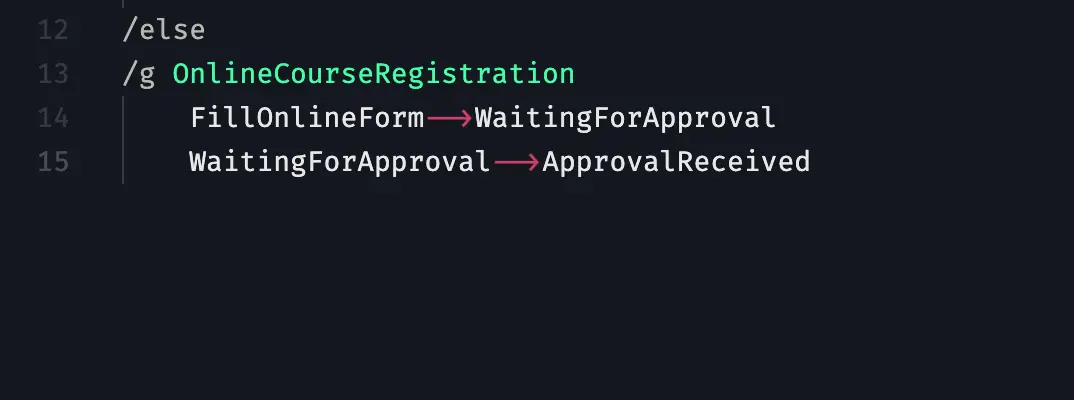
For 'Online Course Registration', students fill out an online form. Upon form completion, they enter a waiting phase where their application awaits approval. Finalization of this concurrent state occurs upon receiving approval. To illustrate it in Gleek, first, type "/else":
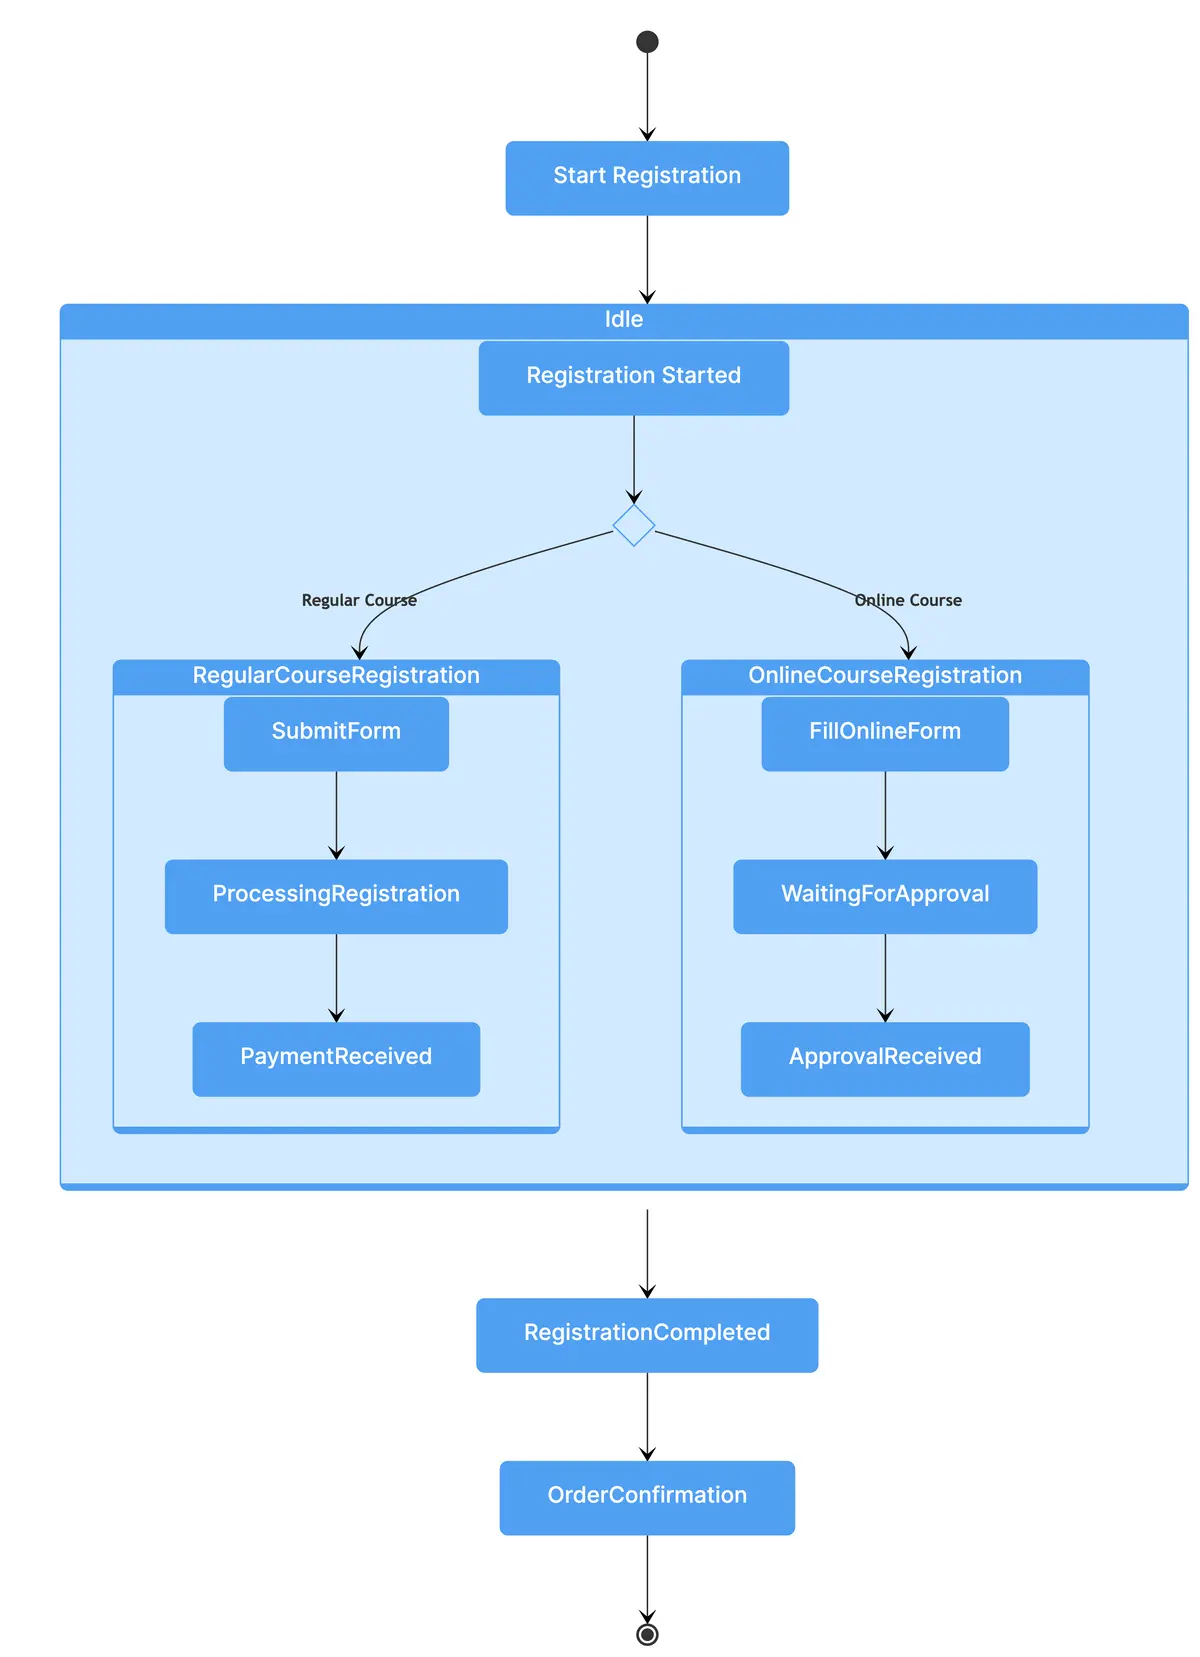
Step 9: Define the Culmination State
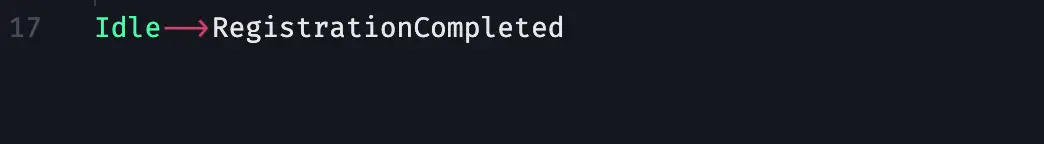
The culmination of both tracks is the 'RegistrationCompleted' state. Connect 'Idle' to 'RegistrationCompleted'. Post-registration, students confirm their details, progressing to 'CompleteRegistration,' culminating in an 'OrderConfirmation.'
Step 10: Signify the End of the Process
To signify the process's conclusion, use the same symbol as the start.
Create your own state diagram.

Wrapping Up
We've successfully completed a state diagram for the student registration process using Gleek.
This diagram aids in visualizing the entire process, from initiation to completion. It efficiently represents the various states a student goes through, the decisions they need to make, and the concurrent paths available to them during their registration journey. By leveraging the power of Gleek, we've converted a complex process into an easy-to-understand visual representation.
But our exploration doesn't end here. Gleek is not just about creating state diagrams. It's an AI-powered diagramming tool designed to make your diagramming process as seamless as possible. With Gleek, you can create a variety of diagrams like class, sequence, user journey, entity-relationship diagrams, and even Gantt charts, all without touching your mouse.
Moreover, Gleek's functionality extends beyond just diagram creation. It's a tool that encourages visualization of ideas, streamlining thought processes, and cultivating better understanding and communication. Whether you're a developer designing a new system, a student grappling with complex processes, or a teacher looking to visually convey intricate concepts, Gleek has got you covered.
Create your own state diagram.
Stay tuned for more tutorials and explore the different types of diagrams you can create using Gleek. Embrace the power of keyboard diagramming and elevate your diagram creation process with Gleek!
Related posts
State machines vs. Activity diagrams: Simplifying workflow visualization
Class diagram for a University management system with Gleek AI chat