
Some things are near impossible to explain using words alone. This is especially true in the software world when describing systems, and the relationships between them. How do we solve that problem? With diagrams, of course. Two great tools for creating diagrams across all types of industries are Lucidchart and Draw.io. So, which is the best for your business? Let’s take a closer look at each of them.
What is Lucidchart?
Lucidchart is a popular, US-based diagramming tool with an abundance of different shapes and diagram types to choose from. It’s easy to use, doesn’t need a download, and is compatible with many other programs.
Want to hear our take on Lucidchart vs. Gliffy? Check out our Lucidchart vs Gliffy: a detailed comparison 2021 article on the matter.
What is Draw.io?
Draw.io is another diagram tool from the UK that practically anyone can get the hang of in a matter of minutes. Like Lucidchart, Draw.io also has templates to choose from, and is compatible with other programs. One of the best things about Draw.io is that you can start creating straight away just by visiting their website.
Make your own diagram with Gleek.
What features do they have?
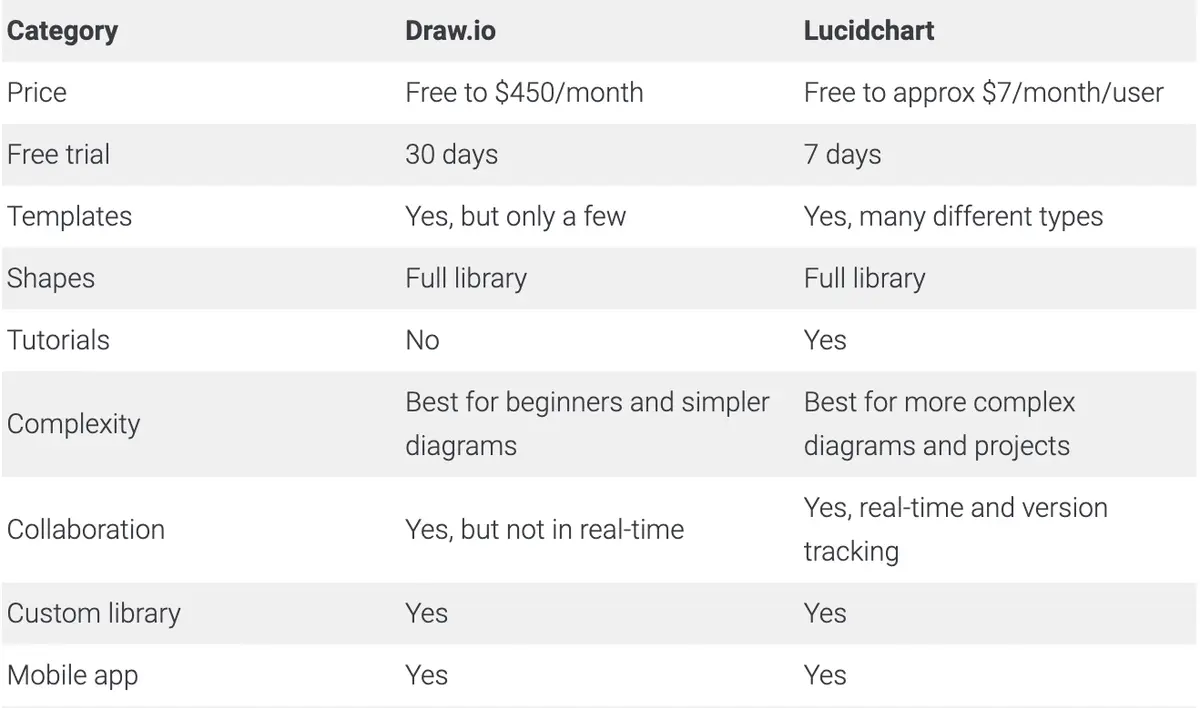
Lucidchart and Draw.io have plenty of things in common, which makes choosing the best one for your team or business a little complicated. While they offer very similar services and benefits, there are some differences that make each stand out.
Templates and shapes
Both have plenty of templates to choose from, be it a flowchart, mind map, or UML diagram. All of the basics are available on Draw.io, but for more intricate and industry-specific templates, like wireframes, Lucidchart is the best choice. As for shapes, both have all the shapes you could ever need. For a more artistic flair, like when creating an infographic or a banner, Draw.io has better style choices.
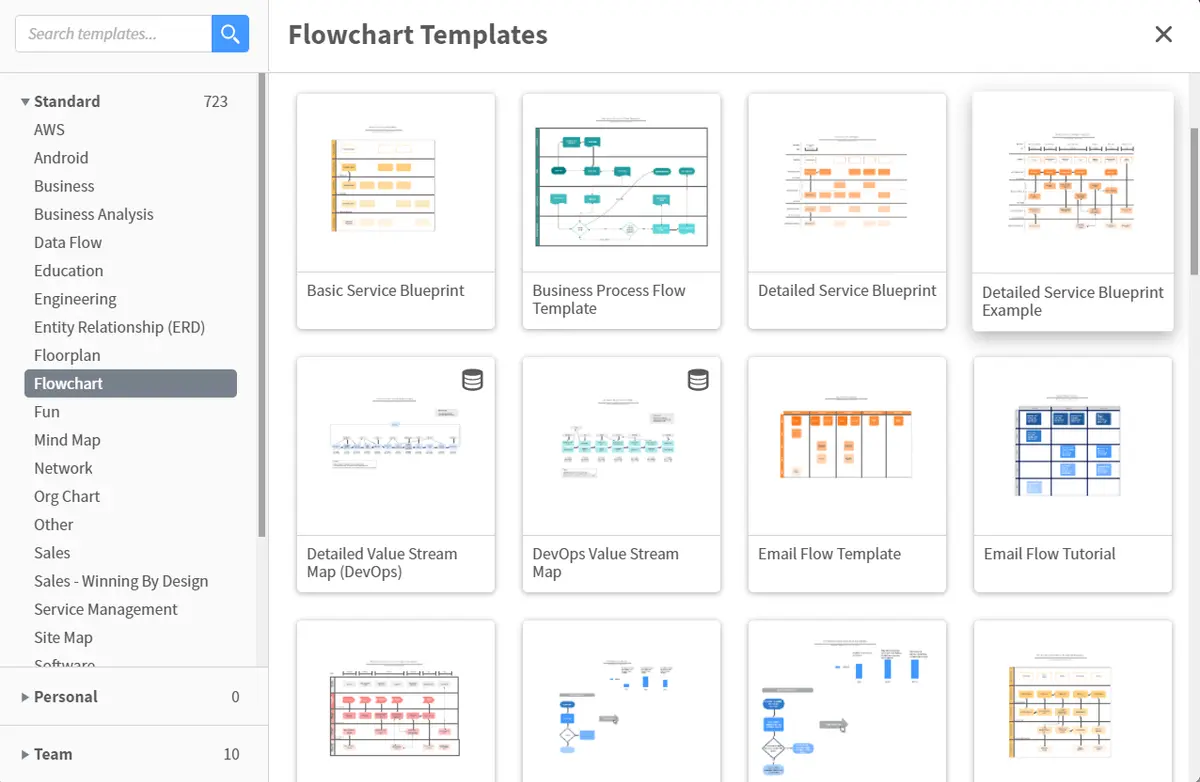
Lucidchart templates
Importing, exporting, and integrations
One great feature you can find in both tools is the ability to import and export files. Files from Google, Gliffy, Jira, Confluence, and more, are all compatible with Draw.io and Lucidchart. Both also allow for third-party integrations from many other services. Have a look at this chart for a better understanding of what programs you can use with each. There are too many third-parties to name here, so check out their websites for a full list.
User interface
What’s more important than usability? Both programs are simple, clean, and intuitive. You can drag and drop shapes as well as files directly onto the diagram. A benefit of Draw.io is that you can start right away, with no sign-up or download. Both options do have downloadable programs, if that’s what you prefer.
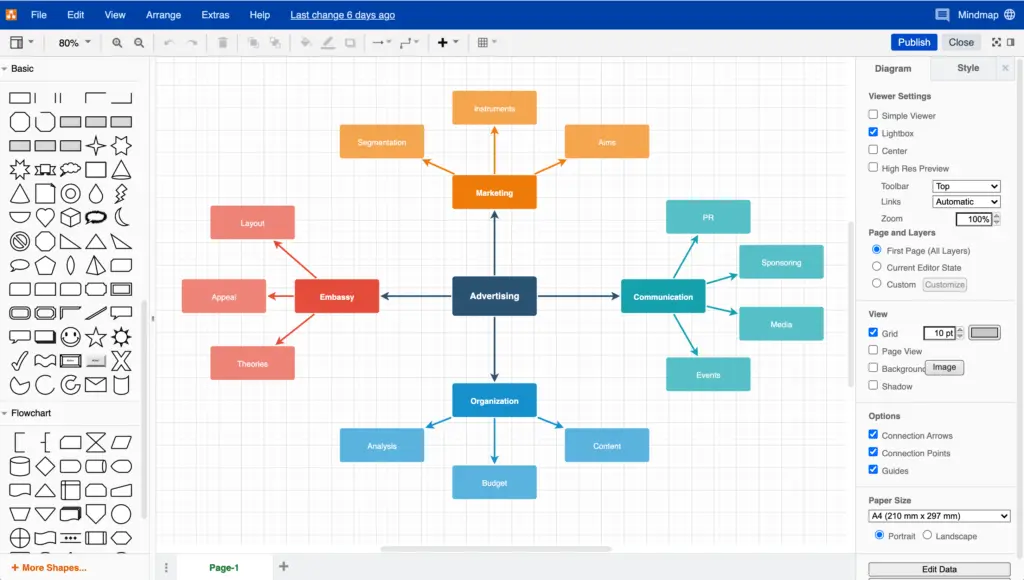
Draw.io interface
Lucidchart has a few features that allow you to tweak your diagram to create perfect symmetry, like showing the distance between two shapes, and their coordinates. Draw.io doesn’t offer these functions, but you can click a shape and have it appear on the diagram instantly, which is helpful for getting things done fast.
More about Lucidchart features in Miro vs. Lucidchart article.
Team collaboration
One of the most important features in our ever-changing, technology-driven world is team collaboration. It’s becoming increasingly common for teams to be located across town, or across the country from their other members.
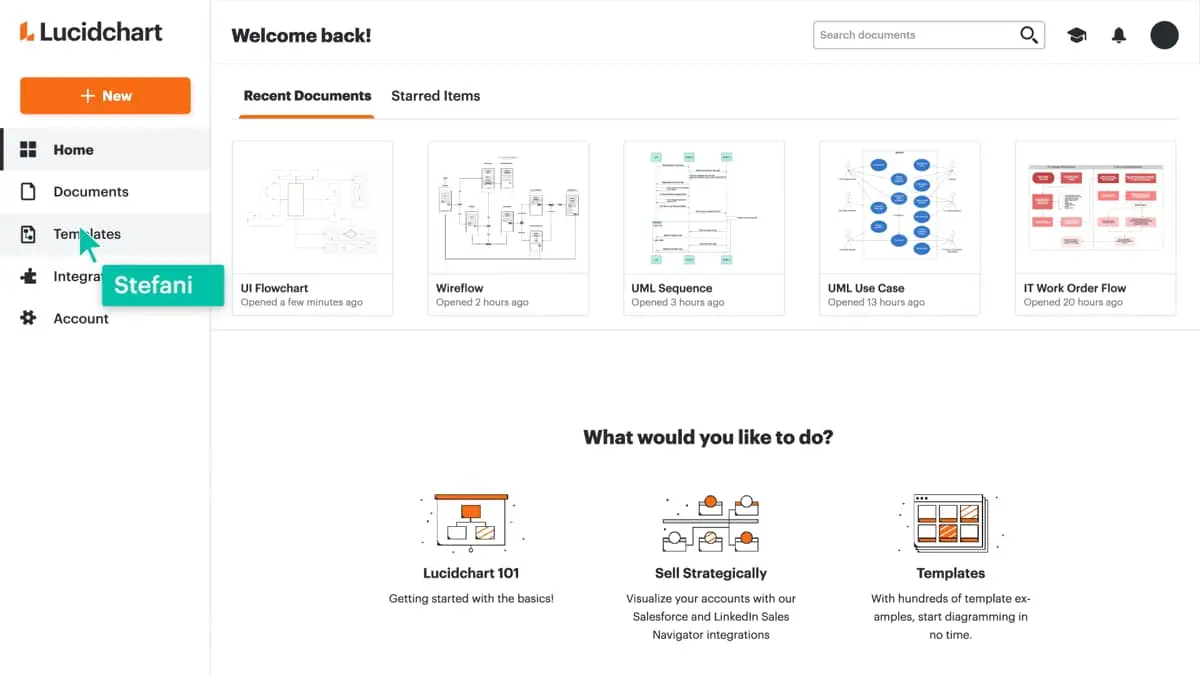
Lucidchart team collaboration feature
Lucidchart offers real-time team collaboration, as well as video chatting and version tracking in their paid package. Draw.io, unfortunately, does not offer such robust features, but it’s still possible to share files easily with your team, provided you have a Google account.
Pricing
Draw.io has more pricing options than Lucidchart, which makes it a little more complicated. You can choose between cloud, data center, and server integration pricing. For those wishing to use Draw.io on cloud services, prices range from $15 per month for teams of 20 users. The maximum number of users who can be on a Draw.io account is 2,500, and that will cost over $450 per month. Draw.io users who chose to use a data center subscribe by the year; teams up to 500 users will pay $6,000 per year, and teams of up to 5,000 will pay around $10,000.Prices vary for server integration, from $10.00 to $1,800 per month. Not sure if you want to commit to Draw.io? Try any of their plans free for 30 days.
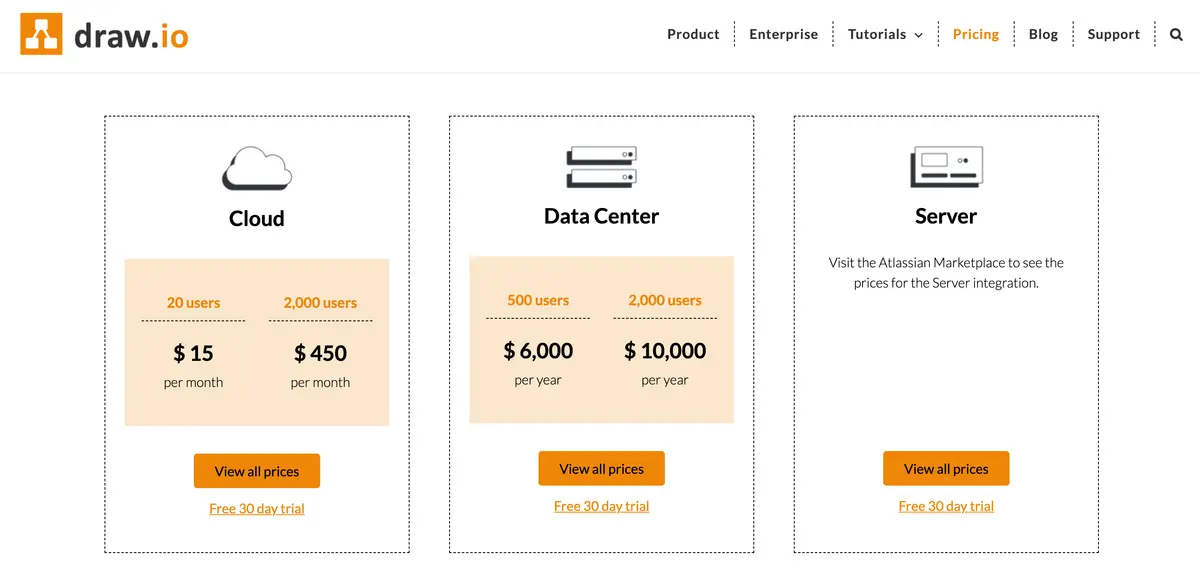
Draw.io pricing
Lucidchart’s pricing is more straightforward, but less customizable. There is a free version with fewer features and a smaller library, and you can also choose plans for individuals, teams, or enterprises. On the individual plan, you’ll pay $7.95 per month, and $6.67 per user per month with the Teams option. Pricing for large businesses is available by request only.
Make your own diagram with Gleek.
Which is better, Draw.io or Lucidchart?
Of course, the matter of ‘which is best’ depends on your needs. For larger enterprises, with more complex diagram requirements, Lucidchart is widely regarded as the best choice. For things like engineering, software design, and architecture, Lucidchart will provide you with all the support and options you need. However, for diagrams you need on the go, or for more creative designs, Draw.io is best suited to those categories. Still not sure which one is best for you? Try their free trials, and see which one you like more.
Read also on various Lucidchart alternatives.
Gleek: a new diagramming tool
Tired of dragging and dropping? There’s another option, namely, Gleek. Gleek.io is a text-based diagramming tool that allows you to easily create without ever having to touch your mouse. It’s easy to use, free to start, and all you need is a keyboard.
Make your own diagram with Gleek.
Gleek.io works as a standalone app or as a plugin for Confluence available in the Atlassian Marketplace. With Gleek’s free plan you gain access to all diagramming tools, but with the premium and team plans, you can get so much more. Not only can you create an unlimited number of diagram options and files, but you can also export in several formats, including high resolution or PDF. There are also video tutorials to help you get started, as well as syntax help that helps you find what you need without any guesswork. Check out how to start with Gleek!
Related posts
Lucidchart vs Gliffy: a detailed comparison 2022
Smartdraw vs. Visio: Which tool is best for you?