
The tools you use in project management can significantly impact the success or failure of your endeavor. Having a clear, visual representation of your project's timeline, tasks, and milestones is important for effective planning, execution, and monitoring.
Among the multitude of project management tools available today, Pert and Gantt charts stand out as two of the most popular and widely used. These charts serve as blueprints for your project, providing a graphical overview of the entire project timeline and individual task schedules.
In this comprehensive guide, we will explore Pert and Gantt charts' structures, use cases, and the scenarios in which they excel. We'll also introduce you to Gleek, a powerful tool for creating Gantt charts using simple syntax commands.
Make your own Gantt chart in Gleek.
Once finished reading this article you will be fully equipped with knowledge and tools needed to select and utilize the right chart for your project, thereby enhancing your project management efficiency and effectiveness. Let's begin.
Understanding Pert charts
Developed during the 1950s to manage large-scale projects, the Program Evaluation Review Technique, or Pert chart, is a project management tool that provides a graphical representation of a project's timeline. The Pert chart helps in planning, scheduling, coordinating, and monitoring the tasks in a project.
Explanation of Pert charts
A Pert chart is a diagram that displays the tasks involved in your project and the dependencies between them. It provides a clear visualization of the project's flow, giving you a bird's eye view of all the tasks that need to be done, their sequence, and how they relate to one another. This visual clarity can help you better understand the scope and structure of your project, spot potential bottlenecks, and plan more effectively.
Components and structure of Pert charts
At its core, a Pert chart consists of nodes and arrows. The nodes, often represented as rectangles or circles, stand for events or milestones within the project. These are points in time that signify the start or completion of various tasks.
The arrows represent the tasks themselves - the actual work that needs to be done to move from one event to another. The direction of the arrows shows the sequence of tasks, essentially mapping out the path that needs to be followed to complete the project.
One of the key features of a Pert chart is its ability to show parallel tasks - tasks that can be done simultaneously. This is extremely useful for shortening project timelines and improving efficiency.
Use Cases and scenarios where pert charts excel
Pert charts are particularly useful in projects where the task times aren't known with certainty, which is often the case in research and development projects, software development, and other complex, non-routine projects. In these scenarios, Pert charts allow project managers to plan for uncertainty and manage risks more effectively.
By providing a clear visual representation of the project timeline and the dependencies between tasks, Pert charts enable project managers to identify the critical path - the sequence of tasks that directly impacts the project's duration. This helps in prioritizing tasks, allocating resources more effectively, and making informed decisions to keep the project on track.
Exploring Gantt charts
Named after its inventor, Henry Gantt, a Gantt chart is a horizontal bar chart used in project management to illustrate a project schedule. It provides an easy-to-understand visual timeline for each phase and activity, making it a valuable tool for planning and scheduling projects.
Unlike Pert charts, Gantt charts provide certainty about the project's timeline, clearly showing when each task begins and ends. This precision makes them particularly useful for projects where tasks and timelines are well-defined, providing a clear roadmap for project execution.
Components and structure of Gantt charts
A Gantt chart is composed of rows and columns, with each row representing a different task or activity. The left-hand column lists the tasks, while the horizontal bars in the chart show the duration of each task.
The length of each bar corresponds to the duration of the task it represents, with the start and end dates marked on the chart's timeline. This visual representation allows you to see at a glance when each task should start and finish, which tasks overlap, and how they're connected.
Make your own Gantt chart in Gleek.
Moreover, Gantt charts also can display task dependencies, a critical feature for managing complex projects with interrelated tasks. This is achieved by connecting the dependent tasks with arrows, visually indicating the sequence and relationship between them.
Use cases and scenarios where Gantt charts shine
Gantt charts are ideally suited to projects where tasks and their durations are known and fixed. They excel in scenarios where it's essential to maintain a strict schedule, such as construction, event planning, or product development.
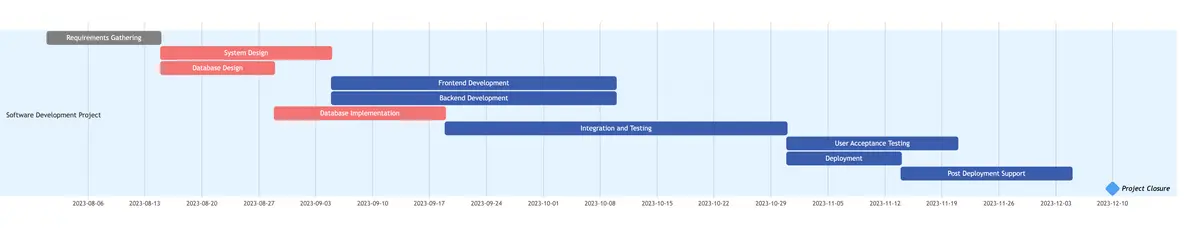
Software Development: Gantt charts are widely utilized in software development, where tasks and their durations are often well-defined. From planning sprints to tracking bug fixes, Gantt charts help teams stay organized and on schedule. They're especially useful in Agile methodologies, where work is divided into small, manageable chunks.
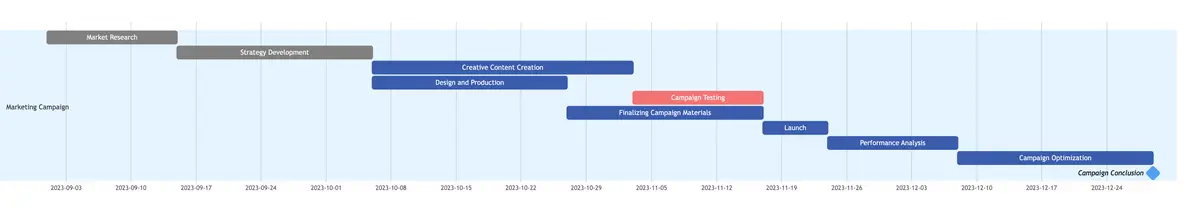
Marketing Campaigns: Gantt charts are also commonly used in marketing to plan and track various campaigns. They allow marketing teams to visualize their strategies over time, coordinate team efforts, and ensure that all tasks are completed within set timelines.
Education and Research: In the education sector, Gantt charts are used by students and researchers alike to plan and track projects. Whether it's a thesis project or a semester-long group assignment, a Gantt chart can help keep everyone on the same page regarding deadlines and responsibilities.
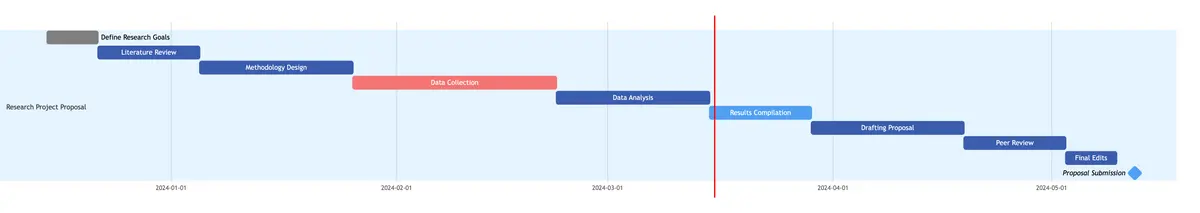
Read a comprehensive guide on how to create a Gantt Chart for a Research Project Proposal in the Gleek app.
Gantt charts in the Gleek app
With the help of tools like Gleek, creating a Gantt chart becomes simple and intuitive. The software allows you to define task groups, specify task status, set start and end dates, determine task positions relative to others, and even add milestones - all using simple syntax commands.
For instance, you can create a task group with "/g Task group name", define tasks within the group by starting a new line and pressing TAB, and specify the task's status as "Done," "Active," or "Crit". You can also define when a task starts in the timeline, its duration, and its end date using a specific format. Gleek also allows you to determine the task's position to another task using "after Task name" or "=> Task name". And if you want to add a milestone, all you need to do is type "milestone" within the task group.
Key differences between Pert and Gantt charts
Understanding the nuances between Pert and Gantt charts can greatly enhance your ability to manage projects. Both charts offer distinct benefits, but also come with their own set of limitations. Knowing when to use each based on project requirements can make all the difference.
Make your own Gantt chart in Gleek.
Detailed benefits of utilizing Pert charts
Pert charts offer several key advantages:
Complexity Handling: Pert charts excel in managing complex projects with many interdependent tasks. They help visualize task dependencies, making it easier to sequence tasks effectively.
Time Management: Pert charts provide an estimate of the project's shortest and longest possible completion times, helping in effective scheduling.
Risk Assessment: By identifying critical paths (the sequence of tasks that directly impacts the project's duration), Pert charts enable proactive risk management.
Resource Allocation: Pert charts facilitate efficient resource allocation by highlighting critical and non-critical tasks.
Advantages offered by Gantt charts
Gantt charts, on the other hand, offer a different set of benefits:
Simplicity: Gantt charts are straightforward and easy to read, making them suitable for communicating project timelines to all stakeholders.
Timeline Visualization: Gantt charts provide a clear visual timeline for each task, allowing for better schedule management.
Progress Tracking: With Gantt charts, you can easily update and track the progress of individual tasks against the planned schedule.
Flexibility: Gantt charts allow for easy adjustments to the schedule as project requirements change.
Read on for another detailed comparison of the Gantt Chart and Timelines.
Disadvantages of each chart type
While both chart types have their strengths, they also come with some limitations. Pert charts can be complex to create and may not be suitable for small, simple projects. They also rely on accurate time estimates, which can be challenging to provide for every task.
Gantt charts, while simpler, may not adequately represent task dependencies. They also require fixed timelines, which may not always be realistic in dynamic project environments.
Selecting the right chart for your project
Choosing the right chart for your project is a critical step in effective project management. Both Pert and Gantt charts offer distinctive advantages, making them suitable for different scenarios. Here are some factors to consider when deciding between the two:
Pert Charts: For Complex Projects with Uncertain Durations
Pert charts excel in managing complex projects where task dependencies and time estimates are critical. They're particularly useful when there's uncertainty around task durations. By visualizing the sequence of activities and highlighting the interdependencies, Pert charts provide a clear picture of the project's critical path and potential bottlenecks.
In situations where tasks have varying durations or are intertwined with uncertainties, Pert charts provide clarity. Their ability to visualize these uncertainties helps in anticipating and managing risks effectively.
Gantt Charts: For Defined Projects with Fixed Timelines
Gantt charts are ideal for projects with well-defined tasks and fixed timelines. They're particularly effective for communicating timelines to stakeholders and tracking progress against the plan.
In scenarios where tasks have clear start and end points and are not significantly dependent on each other, Gantt charts simplify the visualization of the project timeline. They're particularly handy in ensuring adherence to deadlines and highlighting overlaps or gaps in the project plan.
Read on Top Gantt chart alternatives in 2024.
Case Studies Illustrating Successful Chart Selection
To illustrate, let's consider two hypothetical projects:
Website Development (Gantt Chart): A small team is tasked with developing a website within a month. The tasks are well-defined and the timeline is fixed, making a Gantt chart the perfect tool. With the help of the tool like Gleek, the team can quickly create a Gantt chart outlining the tasks, their durations, and dependencies, and track progress effectively.
Make your own Gantt chart in Gleek.
Software Deployment (Pert Chart): A company is deploying a new software system. The project is complex with many interdependent tasks and uncertain task durations. A Pert chart would be ideal here, helping to visualize task dependencies and manage the uncertainty around task durations.
Conclusion: Successful project management through chart selection
As you navigate your project management journey, consider your project's specific needs when selecting between Pert and Gantt charts. The size, complexity, and team dynamics of your project should all factor into your decision. Remember, the key to successful project management lies in choosing the right tools based on your project requirements.
That's where the Gleek app comes in handy for creating Gantt charts efficiently. This AI-powered online diagramming tool simplifies the process of developing detailed and visually appealing Gantt charts. Gleek's user-friendly interface enables swift outlining of task sequences, milestones, and timelines. By leveraging Gleek, users can seamlessly generate precise and comprehensive Gantt charts, aiding in clear project visualization and progress tracking. Its adaptable features align well with diverse project demands, providing an invaluable resource for effective project management and streamlined chart creation.
Create a Gantt chart with Gleek to see how it works.
Related posts
Beyond Traditional Planning: Top Gantt Chart Alternatives in 2024
Gantt chart critical path explained
Differences between Kanban and Gantt charts
Gantt Chart for a Research Project Proposal: Step-by-step guide