
What is an entity-relationship diagram and what is it for?
An entity-relationship (ER) diagram, ERD, or entity-relationship model, is commonly used in the early stages of designing a database. An ERD is perfect for quickly sketching out the elements needed in the system and explaining how they interact. ER diagrams can be shared with colleagues and their simplicity makes them ideal even for non-technical stakeholders.
Creating an ERD helps the designer understand the requirements of the system and map out how the entities to be included will work together. The diagram also makes it easier to spot potential problems and correct them before moving on to the later stages of the design process, when fixing mistakes would be more time-consuming.
Make your own ER diagram in Gleek.
An ER diagram consists of entities, attributes, and relationships. Entities are the basic real-world elements, attributes describe their characteristics, and relationships describe how entities interact with or affect each other.
ER diagrams depict the types of entities to be represented in the system and there will be many instances of each entity type in the actual system when built. The ERD therefore also needs to represent cardinality, or the possible number of each entity that can be associated with the number of another entity.
For instance, a company personnel database will have departments, employees, and will contain the personal details of those employees. A department will have many employees, while an employee might only be associated with a single department. This would mean that there was a one-to-many relationship between the department and the employee. Each employee will have a unique employee ID, so that will be a one-to-one relationship. Three of the most obvious examples of cardinality are one-to-one, one-to-many, and many-to-many.
Cardinality is represented in an entity-relationship diagram by using notation to clarify the relationships between entities. Two commonly used systems of notation are Chen notation and Crow’s Foot notation. But what are the differences between them and how can you decide which is right for you? Join us for a detailed comparison between Chen notation and Crow’s Foot notation.
What are the components of Chen notation?
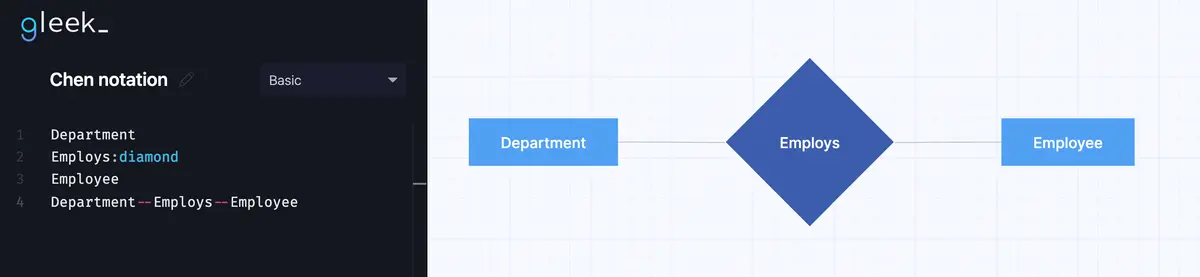
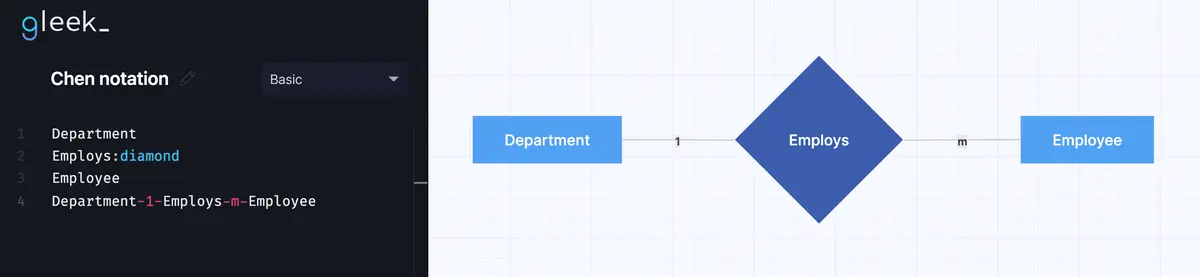
Chen notation was introduced in 1976 by Peter Chen, one of the pioneers of the entity-relationship model. Chen’s notation system uses rectangles to represent entities and diamonds to represent relationships, so our department and employee example from above would be two rectangles connected by a diamond with the nature of the relationship shown in text inside the diamond.
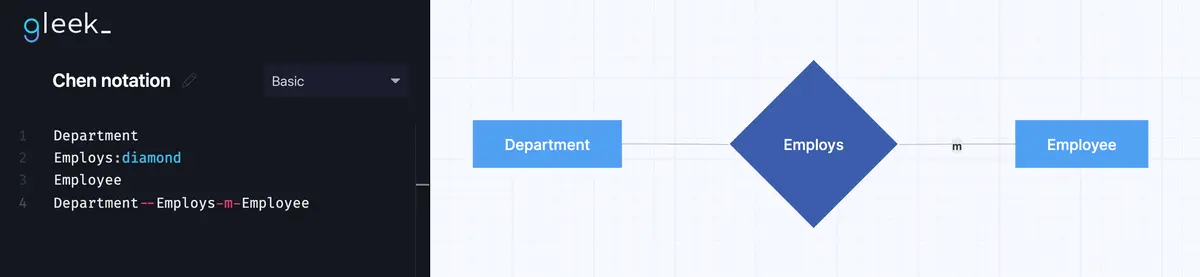
To display cardinality, Chen notation uses the letter m to indicate many on one side of the relationship. The m simply means any number greater or equal to one. It uses a 1 to indicate one and only one.
Here’s an example to show that a department can employ many employees.
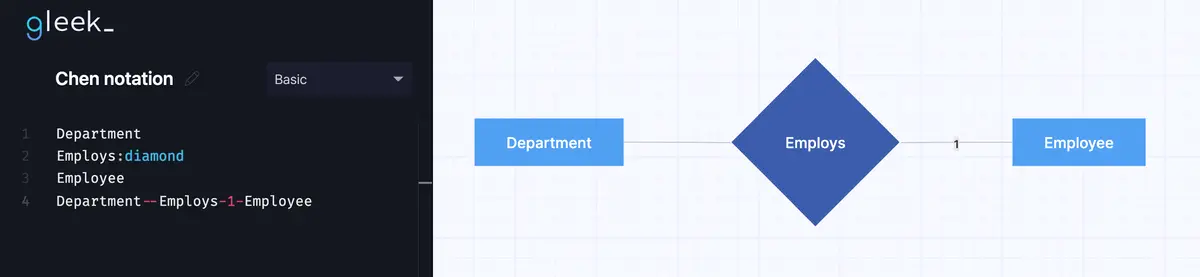
And in the unusual case of a department that can only employ a single employee, we would use a 1 instead of the m.
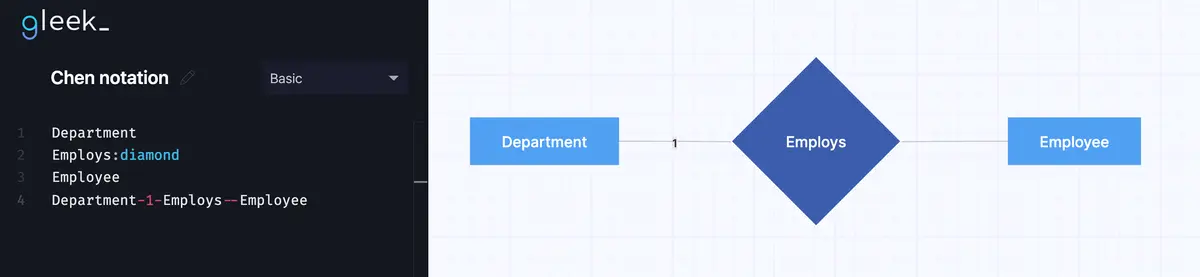
If an employee can only work for one department, we can show this by adding a 1 on the other side of the relationship link.
And finally, to bring it all together, we show both cardinality indicators at the same time to represent that a department can have many employees, but an employee can only be employed by one department.
What are the components of Crow’s Foot notation?
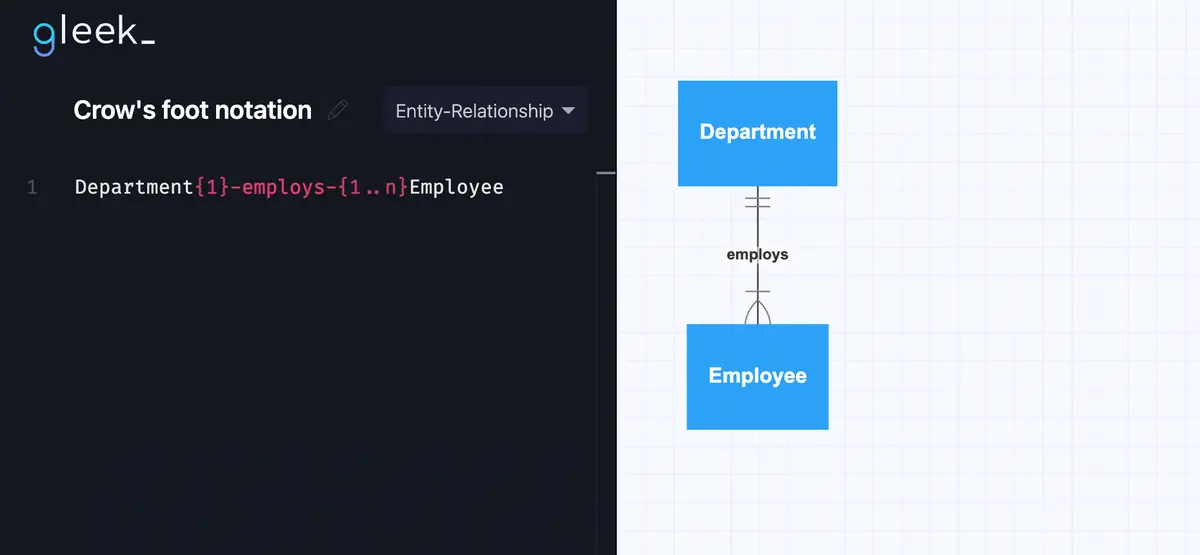
Crow’s Foot notation can also be traced back to 1976, when it was introduced by Gordon Everest, and it also uses rectangles to represent entities. Relationships are represented by lines between the boxes with different shapes, or forks, at the end to show cardinality. The line can also be labeled with the nature of the relationship. Our department and employee example would again be two rectangles, but with no diamond between them.
Cardinality is shown in this case by the “crow’s foot” fork on the employee side of the relationship. This indicates that there can be many employees.
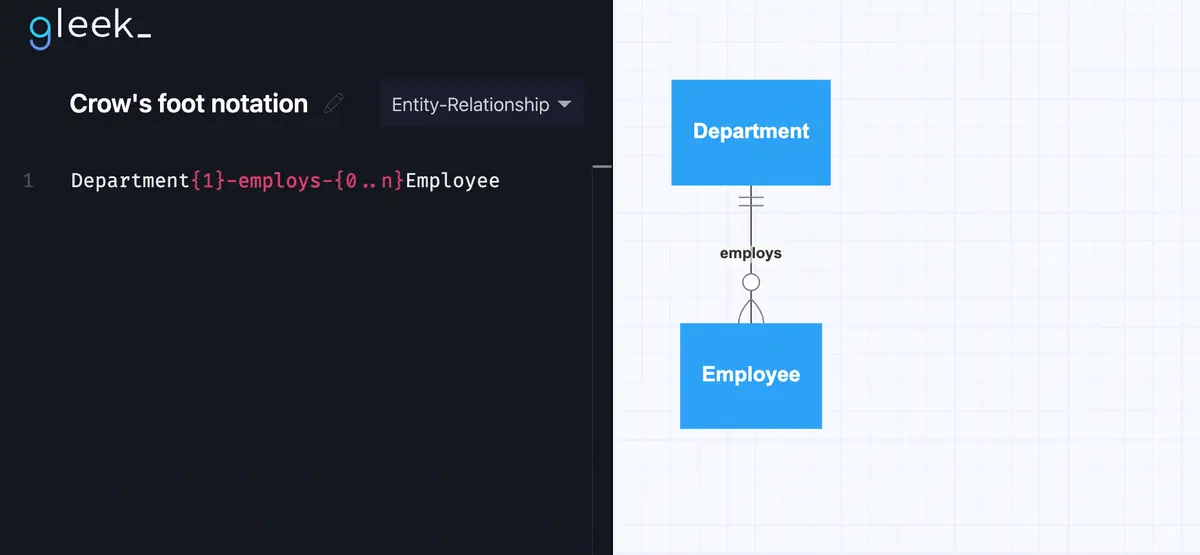
If a specific department can employ zero employees, but still exist, this relationship can be shown by adding a zero to the line. This indicates that it can have none, one, or many employees.
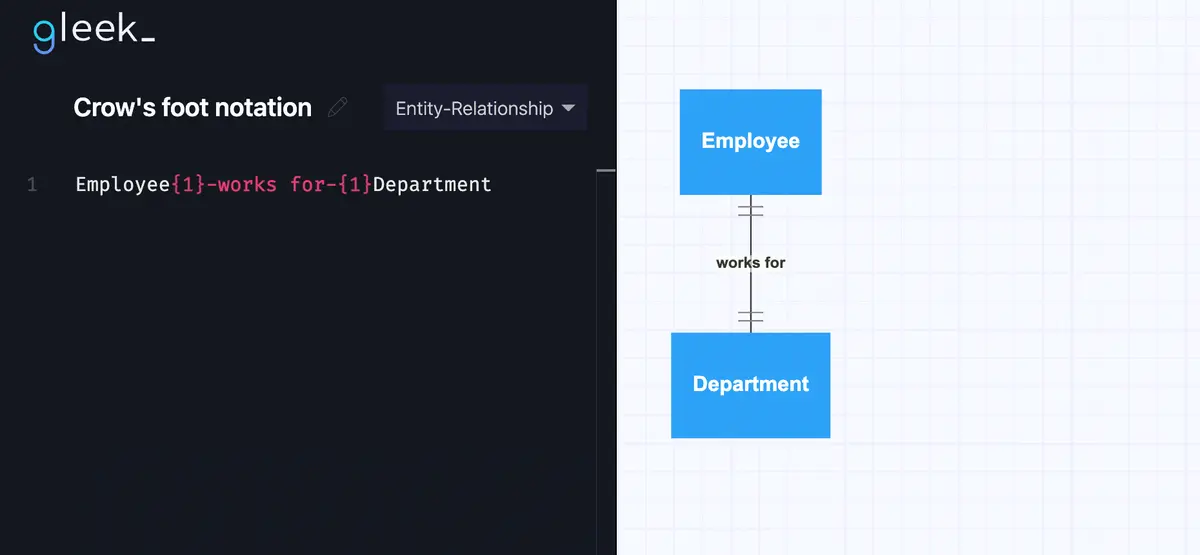
To show that an employee can have one and only one department, Crow’s Foot notation uses two vertical lines or pipes. That makes it clear that the value must be one, but cannot be more than one. Note that we can also add a label here to show that an employee “works for” a department.
Check out the recent step-by-step articles on How to create ER diagram for an Online shopping system and for a Hospital management system using Crow’s foot notation.
What are the main differences between Crow’s Foot and Chen notation?
These examples should make it clear to you that, while both the Crow’s Foot and Chen notation systems can show the same information, they do it in very different ways. Even after almost 50 years, some people prefer one and some people prefer the other. But is it just a matter of personal choice? Let’s compare some of the pros and cons of the two systems.
Because it uses diamonds for relationships, Chen notation takes up more space than Crow’s Foot notation. That can be a problem in a large, detailed diagram. Another problem is that only one side of a relationship is usually named. In our examples, it is clear that the employee is employed by the department, but not every case will be so obvious.
Make your own ER diagram in Gleek.
Chen notation also requires symbols that are sometimes criticized as being unintuitive even after the system has been learned. And if the diagram is being shared with someone not familiar with Chen notation, they will need additional information to understand the diagram. With Crow’s Foot notation, there is a good chance that the visual clues will be enough.
Related post: How to create an ER diagram for an E-commerce website with Gleek's AI chat
Crow’s Foot has a slight learning curve if someone has never seen it before, but it is widely argued by designers that the way that it represents relationships is very intuitive, even for non-technical readers. All the information needed is right there on the relationship line and there is very little scope for ambiguity. One potential downside for Crow’s Foot notation is that it hasn’t really been standardized, so there’s more than one version. But at the end of the day, the best way for you to decide which you prefer is to make your own diagrams. Making quick Gleek diagrams is the perfect way to experiment, so head over to gleek.io and try out both Chen and Crow’s Foot notation right now!
Related posts
ER diagram for an E-commerce website with Gleek's AI chat
Composite and other attributes in the entity-relationship model
ER diagram example: online shopping system (Crow’s Foot notation)
How to represent a weak entity in ER diagram
Guide to entity-relationship diagram notations & symbols
UML vs. ER diagrams: A detailed comparison
Crow’s foot notation in entity-relationship diagrams
How do you convert an ER diagram into a relational schema?
Enhanced entity-relationship diagram: features and components
What is data modeling? Types & process
Quick guide to physical data modeling
What is the entity-relationship diagram in database design?
ER diagram for a hospital management system (Crow’s Foot notation)