What is a flowchart?
A flowchart, or flow chart, is a type of diagram that shows a step-by-step view of a process. The flowchart documents the tasks and decisions needed for the goal to be achieved. A basic flowchart is easy to make and understand and so flowcharts are commonly used in business, engineering, software design, and many other different areas.
Flowcharts are good at clearly explaining complex processes and help in planning and analyzing the activities involved, documenting the necessary decision-making, and understanding the final results. Understanding the process can help stakeholders identify weaknesses and potential failures in the process before they even start.
A typical flowchart consists of various boxes of different shapes connected with arrows. Flowcharts are commonly read from top to bottom or left to right.
Flowcharts have been in use for over 100 years, with the first recorded mention in 1921. Flowcharts entered the world of business in the 1930s, while they reached computer programming by the very end of the 1940s. However, by the 1970s, more complex programming languages rendered flowcharts of less use to engineers designing computing algorithms. Despite this, flowcharts have lived on in both information technology and other fields, with modern techniques such as UML (Unified Modeling Language) diagrams giving new life to an old, reliable approach to representing processes.
Types of flowcharts
Flowcharts are often used in brainstorming sessions, with an initial state traced through all possible stages of development. The simple process of imagining each stage can highlight where the process needs to be improved, extended, or optimized. The same is true of using flowcharts for business decisions. Supply chains can be worked out, responsibility for business domains can be clarified, and sales funnels can be documented. Even after a decision has been made, flowcharts can be used to document the process of reaching that decision. This can help inform future decisions or explain subsequent problems. Flowcharts should be easy for anyone to read, so they can be extremely useful for cooperation between teams that work in different areas.
Symbols used in flowcharts
Flowcharts use some basic symbols that are easy to remember and helpful in rapidly explaining how the process develops from start to finish. Because flowcharts have been around for a very long time, it is a good idea to stick to the standard shapes so that your diagram will be immediately recognizable to anyone reading your flowchart. If you do decide to innovate, make sure you document your changes!
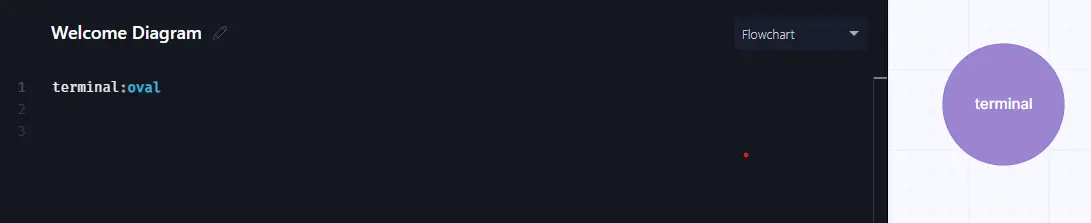
Terminal
This indicates the beginning or end of a flowchart. You will usually start your flowchart with an oval shape as the terminal.
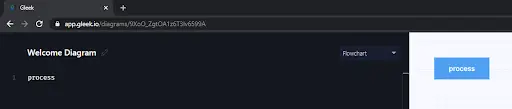
Process
Processes are shown as rectangles in a flowchart. This represents a single step in the development of the flowchart.
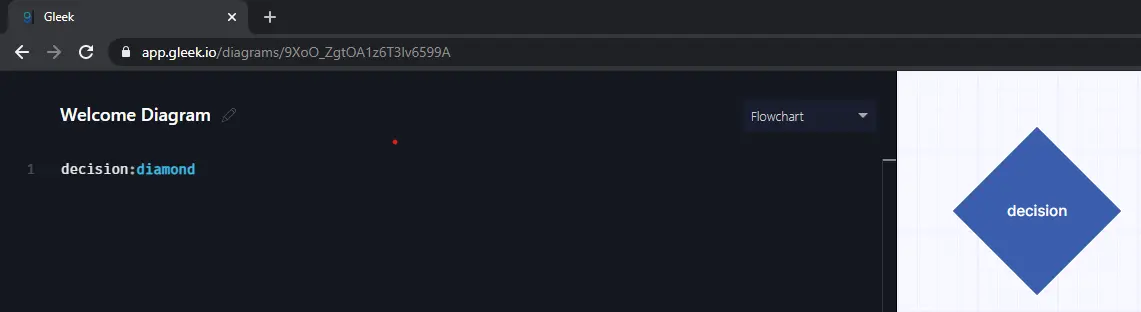
Decision
When your flowchart comes to a point where it can diverge into more than one path because a decision has to be made, you represent this with a diamond shape.
Flowline
These are lines with an arrow showing the direction of the process. It connects two or more shapes and tells you how to follow the development of the flowchart.
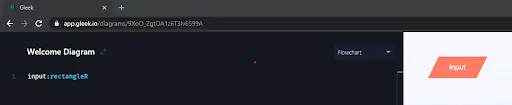
Input/Output
You can represent information entering the flowchart from an external source by means of a parallelogram. Input might be receiving an email, while output might be sending a report.
There are several other symbols that can be used, but these will usually be more than enough for a simple flowchart.
How to create a flowchart in Gleek
Gleek supports all of the above symbols and many more. In fact, you can use our unique Gleek syntax to represent databases, services, and other useful elements, but you will want to start off with the basic shapes listed above. Here’s our quick start syntax guide to creating a flowchart in Gleek.
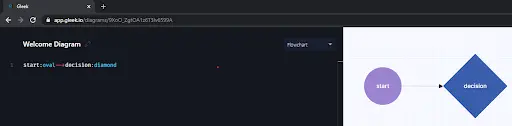
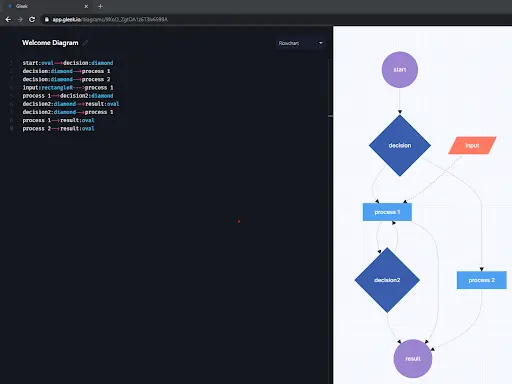
Terminal: use an oval in Gleek to begin your flowchart. Just enter some text as in the following code.
Process: a rectangle is the most basic shape in Gleek. Just add any name or text and it will be shown in a rectangle.
Decision: you can easily create a diamond in Gleek. Just enter the text with the following code added.
Input/Output: create a parallelogram in Gleek with the following code.
Flowline: Gleek enables you to show flowlines with arrowheads just by entering this syntax.
And you can easily combine all these elements to make a really quick flowchart.
Examples of flowcharts
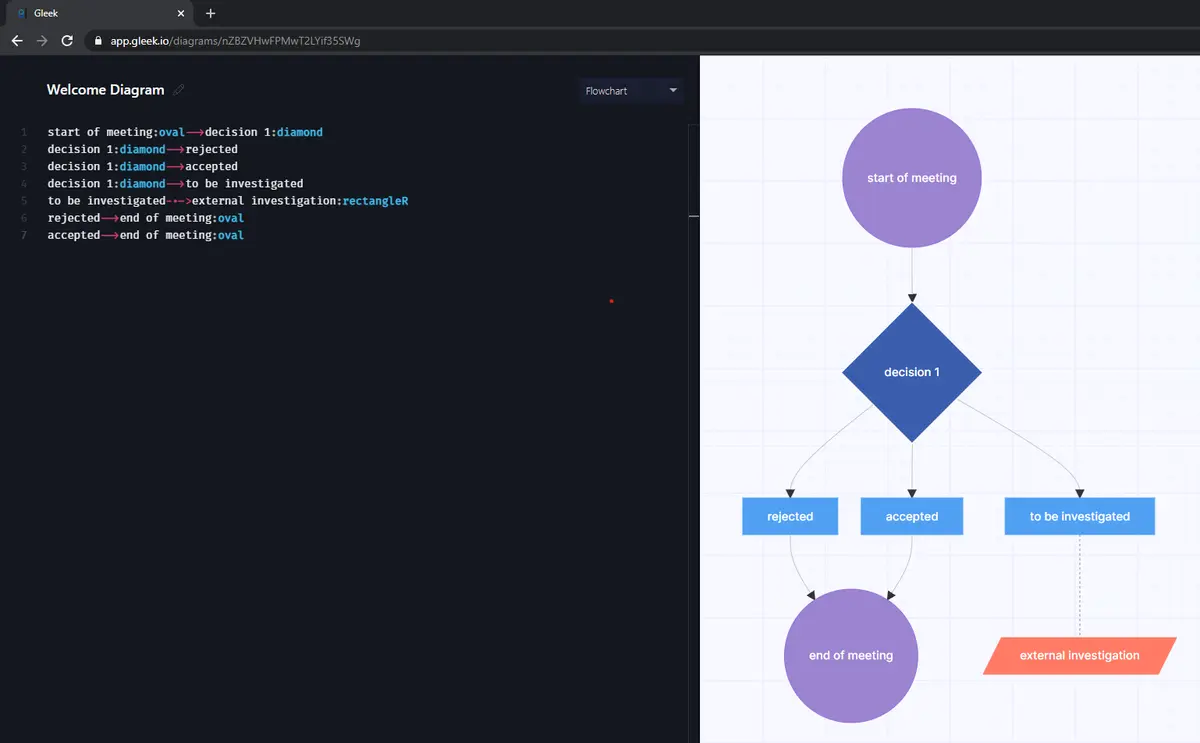
If you have a meeting where one or more decisions have to be made, you might create a quick flowchart like this to keep things on track. As you can imagine, the number of decisions and possible results could be much more complex, as could the processes before the meeting is concluded.
So you need to buy a house. A flowchart could help you remember to ask the right decisions before you make the purchase.
