What is a Gantt chart?
A Gantt chart is a visual project management tool that enables you to organize, schedule and monitor the progress of your tasks within a project. Named after its inventor, Henry Gantt, this chart has been in use since the early 20th century and remains a staple in project management.
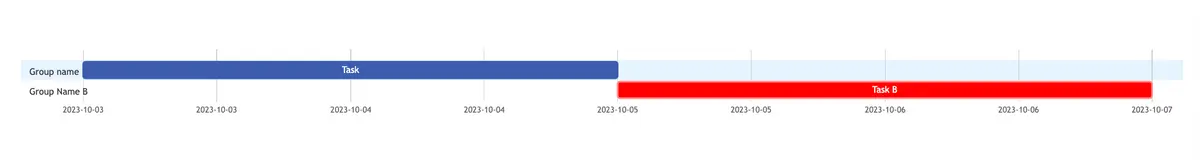
The Gantt chart is essentially a horizontal bar chart that displays the project timeline, the tasks involved, their lengths, and how they overlap. It's a powerful tool that helps project managers visualize the entire project scope, enabling them to plan and allocate resources effectively.
In the context of who uses it, Gantt charts are versatile and can be employed by individuals and teams across various industries. Whether you're managing a construction project, planning an event, or developing software, a Gantt chart provides an at-a-glance view of the entire project lifecycle. It's especially useful for project managers, team members, stakeholders, and anyone who needs a clear understanding of the project's progress.
A Gantt chart helps with scheduling tasks, setting deadlines, identifying dependencies, and predicting the impact of task delays. It also provides a visual representation of the project's progress, making it easier to communicate updates to stakeholders. Moreover, it facilitates better resource allocation, ensuring that no task is neglected or overburdened.
Gantt Chart symbols and elements
A Gantt chart comprises several components that together provide a comprehensive view of the project timeline and tasks. Here’s a detailed description of each component:
Task List: This is essentially a list of all tasks that need to be completed for a project. Each task should be clearly defined with a specific outcome in mind and assigned to a team member. It's important to break down larger, more complex tasks into smaller, manageable sub-tasks. This facilitates better tracking and management.
Timeline: The timeline indicates the duration of each task, from start to finish. It helps in understanding when a task should begin and when it is expected to end. The timeline also provides an overview of the project's lifecycle, helping stakeholders understand the project's progression.
Dependencies: Dependencies are tasks that rely on the completion of other tasks before they can begin or end. Understanding dependencies is crucial to prevent bottlenecks in your project. Dependencies are usually represented by arrows linking different tasks on the Gantt chart.
Milestones: Milestones are significant events or stages in the project. They indicate key deliverables or phases. Achieving a milestone often signifies the completion of a key deliverable, providing a sense of achievement and progress towards the final goal.
Progress Bars: These bars represent the percentage of work completed for each task. A fully filled bar indicates that the task is 100% complete. Progress bars provide a visual representation of task advancement and help to quickly identify tasks that are behind schedule.
Task Status: As mentioned earlier, the status can be categorized into three types: Active, Critical, and Done. The task status gives an immediate overview of where each task stands, allowing project managers to allocate resources efficiently and address potential issues promptly.
It's important to note that a task can have two statuses concurrently. For instance, a task could be both "Active" and "Critical". This indicates that the task is currently being worked on and is also crucial to the project timeline.
Including these components in your Gantt chart can significantly enhance your project management capabilities. They provide a comprehensive overview of your project, allowing you to track progress, manage resources efficiently, and ensure timely completion of all tasks.
How to Create a Gantt Chart in the Gleek App
Creating a Gantt chart using the Gleek app is a streamlined process designed to maximize efficiency and functionality. Follow the steps below to create your own Gantt chart.
Create a Task Group
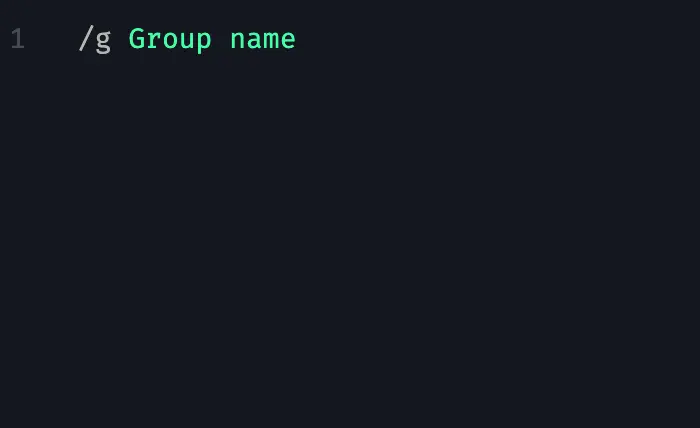
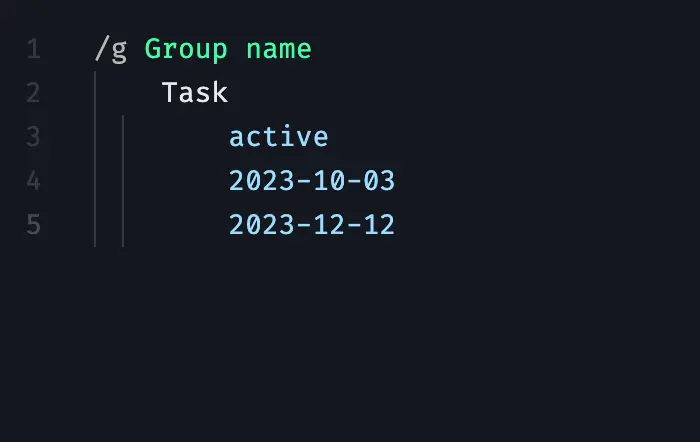
Begin by defining a task group. Use the command /g Task group name to create one. This group can contain one or more tasks related to your project.
Define Tasks
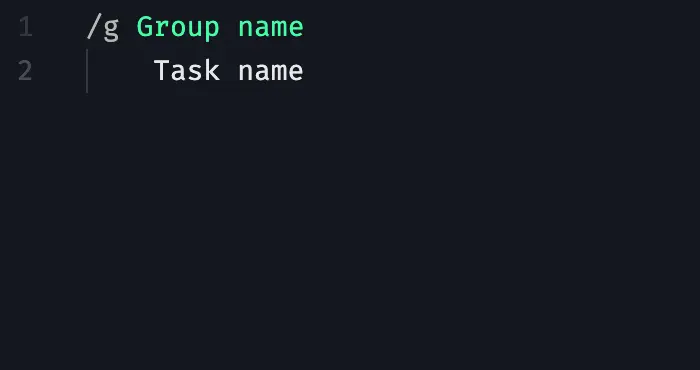
Within this group, you can define individual tasks. Start a new line, press the TAB key, and enter a name for your task. Each task represents a specific activity within your project.
Specify Task Status
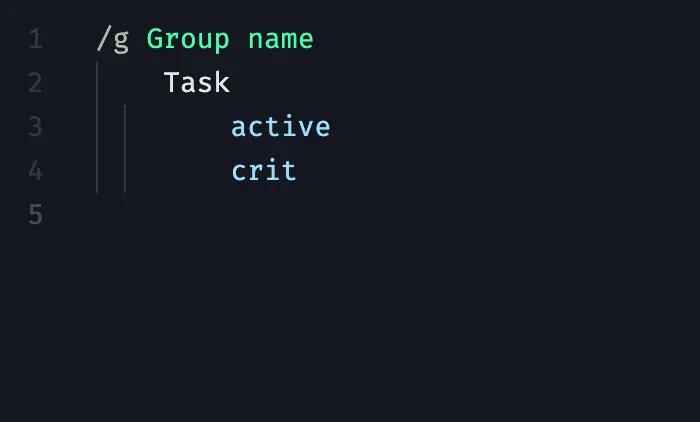
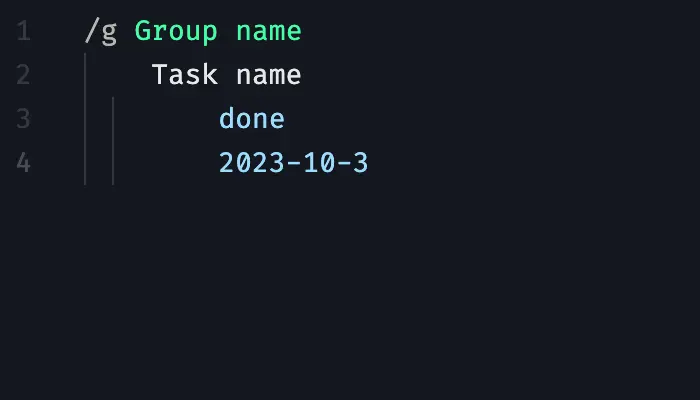
The status of each task can be specified as 'Done', 'Active', or 'Crit' (short for Critical). To do this, start a new line, press TAB, and enter the task's status. If a task doesn't have a status yet, you can leave it blank.

Combined Statuses
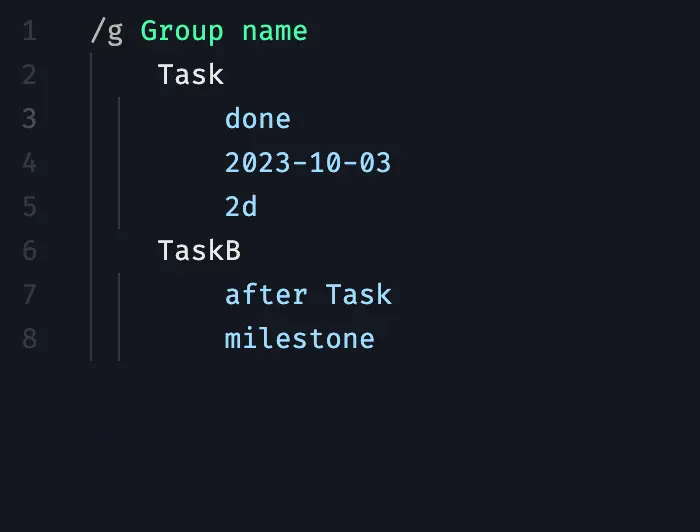
In some cases, a task might have two statuses simultaneously, such as being both 'Active' and 'Critical'. To indicate this, list both statuses one after the other on new lines.
Task Timeline
To specify when a task starts, add the start date in the 'yyyy-mm-dd' format.
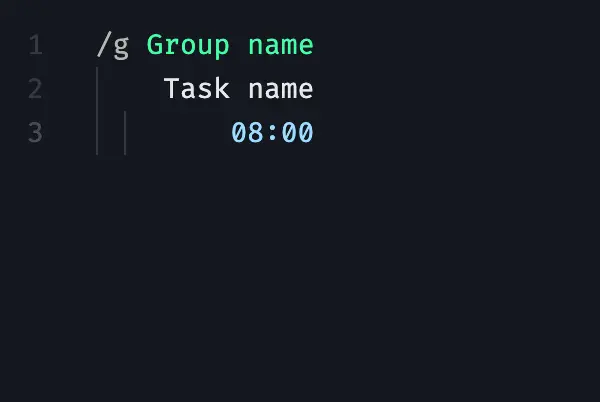
Tasks can also start using the time format “HH:MM”, indicating the specific hour and minute the task begins.
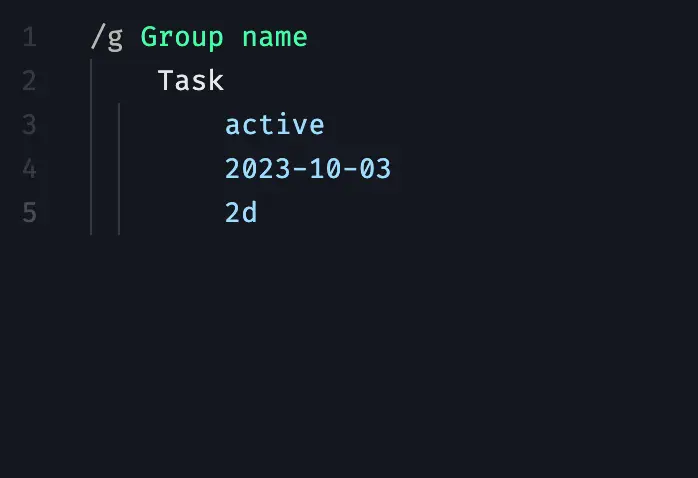
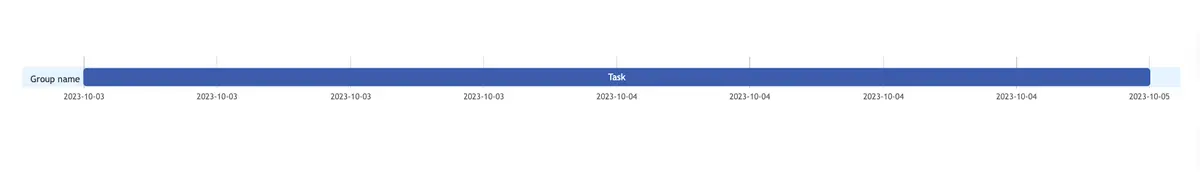
Task Duration
The duration of a task can be defined in terms of minutes, hours, days, or weeks. Use the following format where 'x' stands for a number:
Format | meaning |
|---|---|
'xm' | 'm' stands for Minutes |
'xh' | 'h' stands for Hours |
'xd' | 'd' stands for Days |
'xw' | 'w' stands for Weeks |
Alternatively, you can add an end date in the same format to indicate when the task should be completed.
Task Dependencies
If a task depends on the completion of another task, you can denote this with 'after Task name' or '=> Task name'. This will visually link the tasks, showing the dependency.


Adding Milestones
To include a milestone in your project, simply type 'milestone' within the task group.

With these steps, you can create a comprehensive Gantt chart within the Gleek app, visualizing your project timeline and individual task details without ever touching your mouse. The technical and precise nature of Gleek's keyboard-driven commands ensures clarity and precision, making it an optimal tool for developers, students, teachers, and anyone needing to create sequence or entity-relationship diagrams efficiently.
Gantt chart example: App Development project
Create an app development project group with the command "/g App development project."

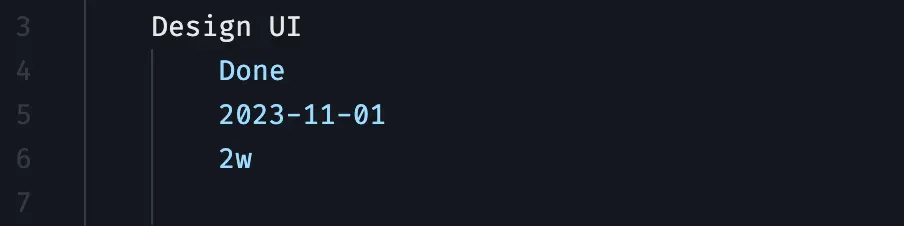
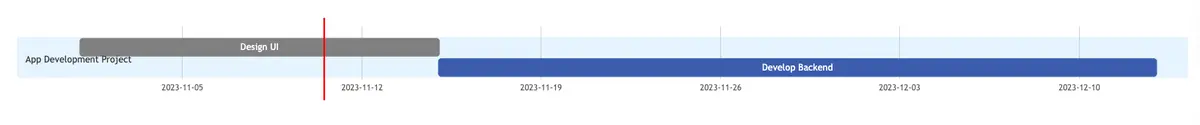
Let's add tasks to this project. The app development project begins with UI Design on November 1, 2023, lasting two weeks.
To convert this information into Gleek's syntax for the Gantt chart, start from the new line and press TAB. Then, type "Design UI." It is going to be the name of this task. After that, start from the new line again, and let's define the status, start date, and duration of this task. Each criterion should be written on a new line.
As the UI design reaches completion, the development team seamlessly transitions into the Develop Backend phase. This critical task, with a duration of four weeks, involves coding the backend infrastructure.
To illustrate dependency in the Gantt chart, type "=>" or "after" and then the task name you want your new task positioned after. In our case, it is "Design UI."
Here is how it will look in the Gleek App:

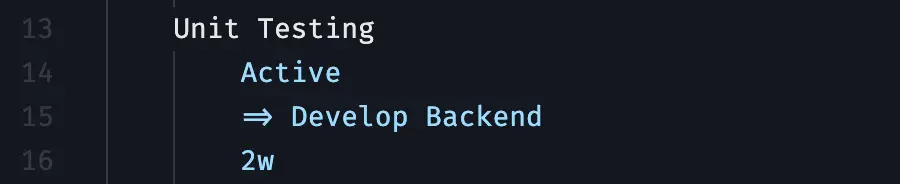
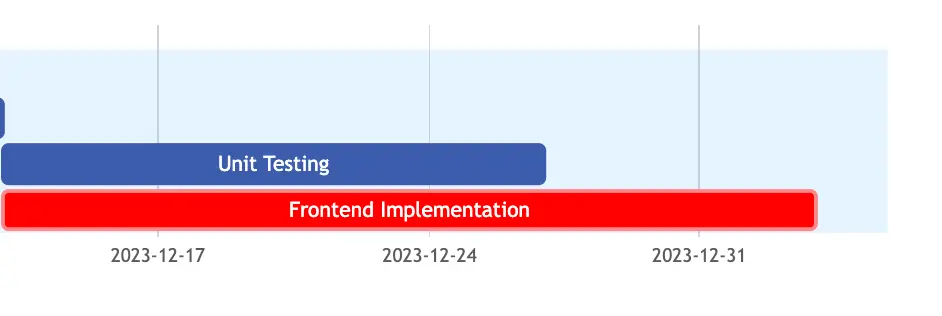
After the backend takes shape, the team embarks on the Unit Testing phase, a two-week process ensuring that individual backend components perform as intended.
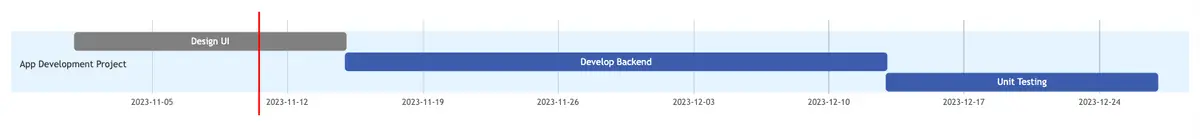
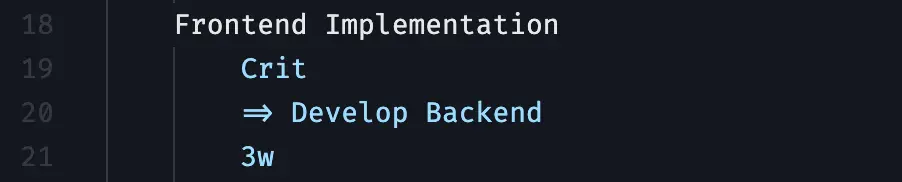
At the same time, the project enters a pivotal stage: Frontend Implementation. Given its critical status, this three-week phase signifies the creation and integration of the user interface. The frontend development aligns with the completed backend, bringing the app's visual elements to life.
To define the status of this task, type "crit" right after the task's name. As a result, the task bar in the diagram field on the right will be colored in red.
Let's convert the given information into Gleek's syntax:
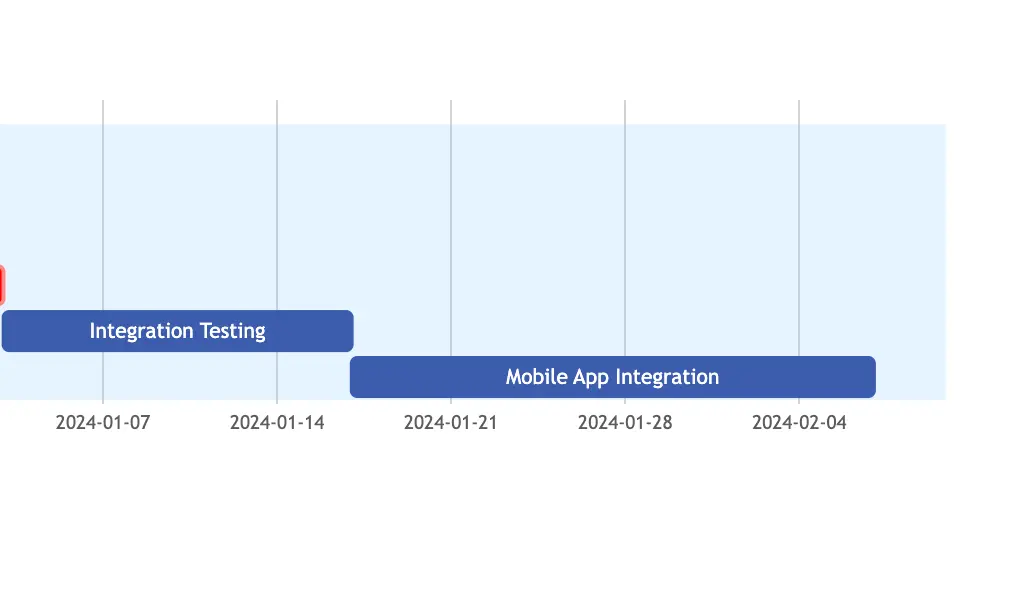
As the frontend comes together, the project seamlessly progresses to the Integration Testing phase. This two-week period is dedicated to testing the interaction between the frontend and backend components.
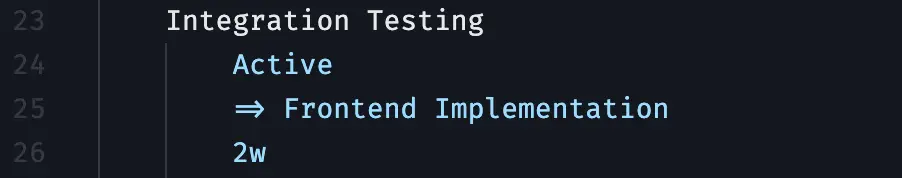
The goal is to guarantee a cohesive and functional integration that aligns with the project's specifications.
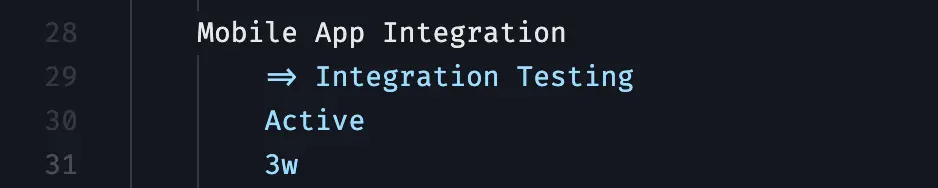
Building upon the successful integration testing, the focus shifts to Mobile App Integration. Over the course of three weeks, the team works on integrating and testing mobile-specific components, ensuring the app functions seamlessly across various devices.
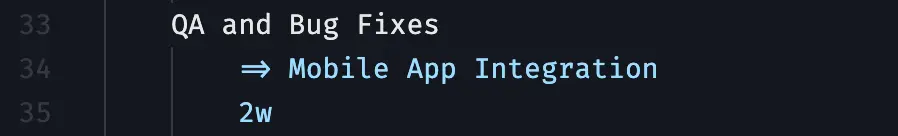
As the project advances, the team dedicates QA and Bug Fixes to refine the app further. This two-week phase involves rigorous quality assurance processes and the resolution of any identified bugs, contributing to the overall stability and reliability of the application.
Note that this task has no status:

Finally, the app development journey culminates in the grand finale: the App Launch. Scheduled for February 25, 2024, this milestone marks the official release of the developed application to users, celebrating the successful completion of the project.

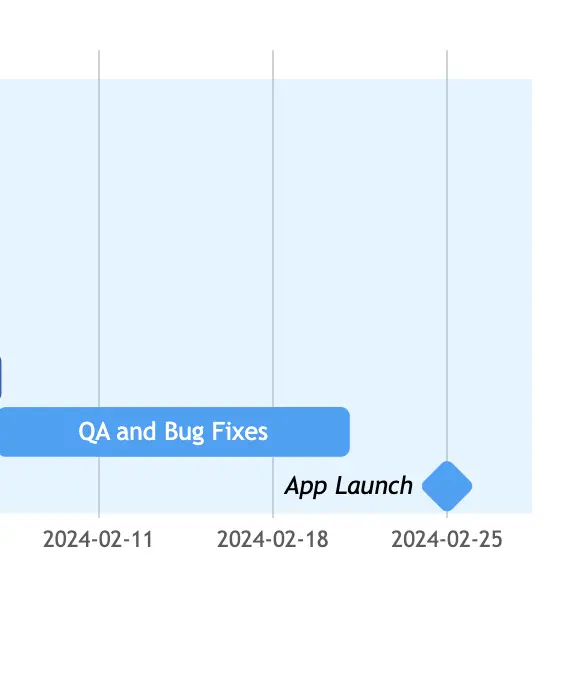
The launch is not just the deployment of an app; it's the realization of the team's efforts, bringing the product to the hands of eager users.
Here is what your App development project diagram is going to look like:
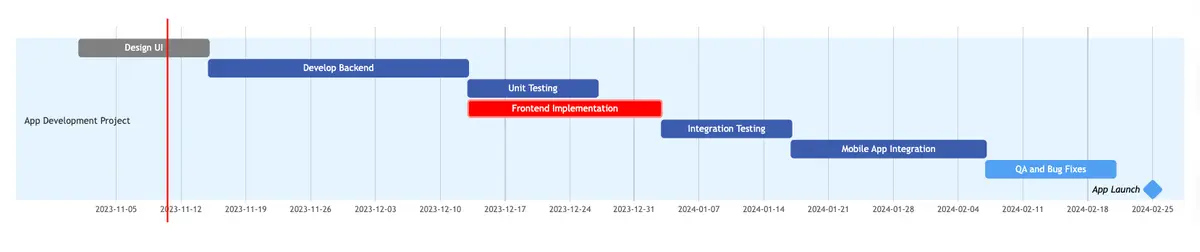
And there you have it. Your App development project Gantt chart is now set up.
With Gleek, effortlessly create Gantt charts of any complexity to ensure your project stays on track!