
What is an ER diagram and what can it be used for?
Entity-relationship diagrams show how data objects relate to each other in a database. With just three basic elements – entities, attributes, and relationships – a database designer can use an ER diagram to sketch out the structure of the system.
An ER diagram is the first step in designing a database and an ERD helps the designer avoid problems down the road when actually creating the database. An entity-relationship diagram can also be used in the opposite direction, to document and analyze an existing system. ER diagrams are even easy for non-technical colleagues to understand, so they can be shared for feedback and to define requirements.
Make your own ER diagram in Gleek.
ER diagrams use a number of different systems of notation to represent relationships. For our hospital management system example, we’ll go with Crow’s Foot notation.
What entities and attributes are needed for a hospital management system ERD?
Before drawing an ER diagram for our hospital management system, we should spend some time considering the entities and attributes we need to include. Our system will be used for managing appointments, patients, doctors, and payments across hospitals. While we’ll just create a small-scale example, a full hospital management system might be used for a nationwide health care service.
The entities we’ll need to create are clear from the requirements: hospital, doctor, patient, appointment, payment, and receipt. Those are the minimum number of data object types that will enable us to manage all the various relationships and processes.
Drilling down further, we need to work out the necessary attributes for each entity. We’ll look at these more closely as we go through the step-by-step example, but for now, we can assume that each entity will need a unique ID, while entities such as doctor, patient, and hospital will need names. The appointment entity will need to record the reason for the visit and the date. Payment will need a cash amount and receipt will need to be associated with a particular patient. You can already see that these types of attributes could rapidly become complex. But our ER diagram will solve that problem by letting you see at a glance how everything fits together!
How do you draw an ER diagram for a hospital management system?
We can start our hospital management system ERD with any of the entities listed above, but let’s choose to create the hospital entity first. You need to open up the Gleek app and select entity-relationship from the dropdown list so that Gleek knows how to format your diagram.
Related post: ER diagram example: online shopping system using Crow’s Foot notation
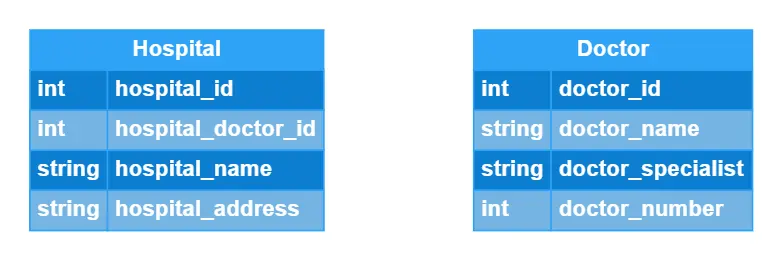
Now just type the word “Hospital” and hit the Enter key. Gleek will draw a rectangle for your first entity. To add attributes, hit the Tab key to indent the next line. Let’s give the hospital its ID number. Because this is a number, we add the word int (for integer) at the beginning. On the next line, we’ll create an attribute that is a composite of the hospital id and the doctor id, so that we can track doctors more precisely. Finally, we need the hospital name and hospital address. Both of these are strings, or in other words any combination of alphanumeric characters.

So that’s our first entity. Now let’s fill our hospital with doctors! Just use the same method, but this time you’ll need doctor ID, doctor name, doctor phone number, and an attribute to record what kind of specialist the doctor is.
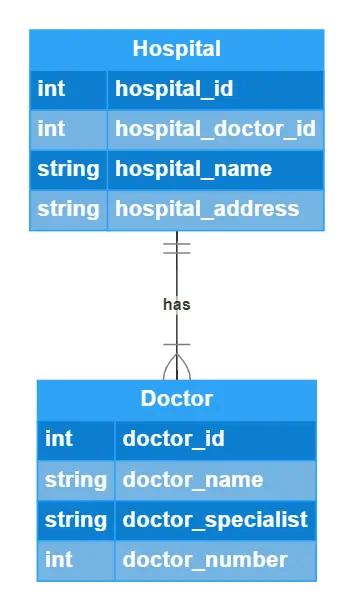
Let’s add our first relationship. This relationship introduces the idea of cardinality, or that each entity can be associated with other entities in numerically different ways. For instance, a hospital can have one or many doctors, while a doctor can have one and only one hospital. Cardinality in ER diagrams is worth exploring further if you want to accurately capture relationships between entities.
Here’s the Gleek syntax for this.
Hospital ||- has-|> Doctor
Note that we’ve included the label “has” so that it will be drawn on the arrow between the two entities. And here’s how Gleek will render that code.
So we have our first two entities and they have a relationship between them. Now it’s time to introduce the patient. You’ll recognize the attributes needed by now and can probably already understand why some are strings and some are integers.
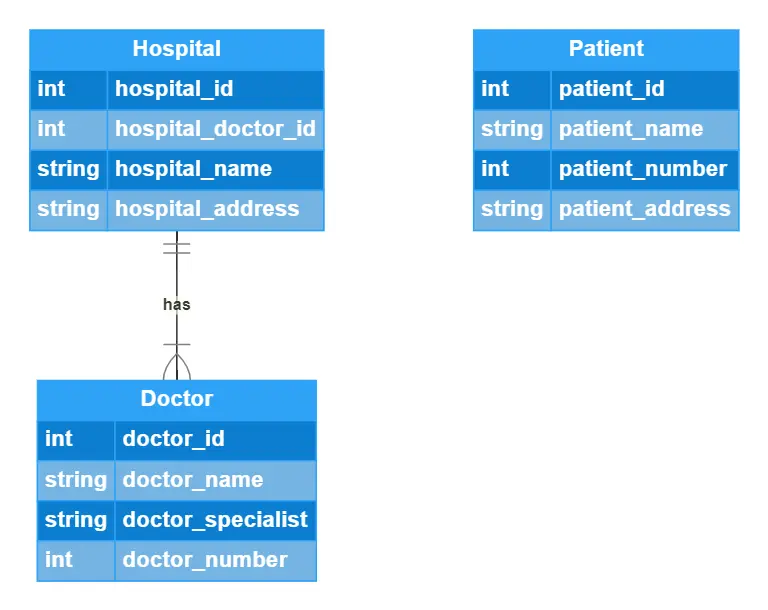
We don’t need to directly associate a patient with either a hospital or a doctor, so we need some intermediate entities to control the relationship between these data objects. The obvious answer is that a patient will have an appointment with a doctor, so we need an appointment entity. There’s nothing too unusual in the attributes here. We can go ahead and create relationships between the appointment, doctor, and patient.
Make your own ER diagram in Gleek.
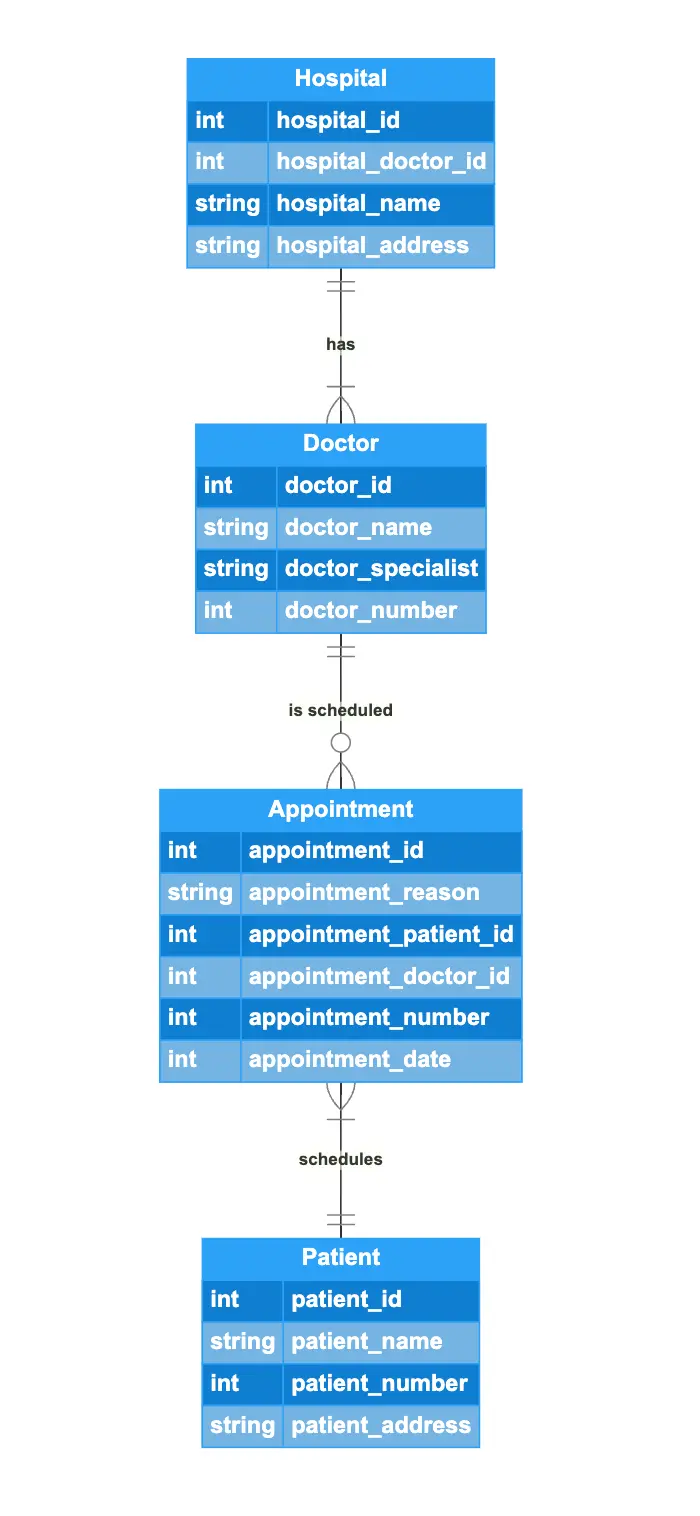
Doctor ||-is scheduled-o> Appointment
Appointment <|-schedules-|| Patient
Again, you can see cardinality in operation here. Each appointment is associated with one and only one doctor, while each doctor can have zero or many appointments scheduled. Each appointment can be scheduled for one and only one patient, but each patient can have many appointments. Here’s how it looks in Gleek.
Our hospital management system requires the patient or their insurance provider to pay for appointments upfront, so we now need to create receipt and payment entities to complete the process.
Read our recent step-by-step article on How to create an ER diagram for an E-commerce website using Gleek's text-to-diagram AI feature.
The first relationship for the receipt is that the appointment generates the receipt. This relationship is on a one and only one basis.

Payment is the next step in finalizing the appointment and this entity has a relationship with both the patient, who pays, and the receipt that is paid for by the payment. Each of these relationships can be zero or many, as there might be many separate payments made by a payment during their interaction with our hospital management database. From the point of view of the payment, however, there is a one and only one relationship between it and the patient and receipt.
Here’s the final ER diagram, including all entities, attributes, and relationships that we need to sketch out this part of the system.

We hope that this has helped you understand how you can use Gleek to quickly draw an ER diagram that can be used in the early conceptual level of designing a database. You can try it out yourself with this ready-made editable template for the diagram. Feel free to experiment with changing the relationships, adding attributes, and finding new entities that might need to be created in the system.
Related posts:
ER diagram for an E-commerce website with Gleek's AI chat
All about ER model cardinality with examples
Relational schema vs. ER diagrams: A detailed comparison
ER diagram example: online shopping system (Crow’s Foot notation)
What is the entity-relationship diagram in database design?
UML vs. ER diagrams: A detailed comparison
Crow’s Foot vs. Chen notation: detailed comparison for 2022
How do you convert an ER diagram into a relational schema?
Enhanced entity-relationship diagram: features and components
11 Best ER diagram tools to use in 2022
Composite and other attributes in the entity-relationship model