
Both activity diagrams and sequence diagrams are used by software developers to show actions and relationships within a software system. But, before we get into these two diagram types, we first need to talk about UML.
Universal Modeling Language, also known as UML, is a standardized language used in software diagrams to represent the items, processes, and relationships within a system. Why is this important? UML is used in both sequence and activity diagrams, along with many other types like class diagram, use case diagram, communication diagram, object diagram and etc.
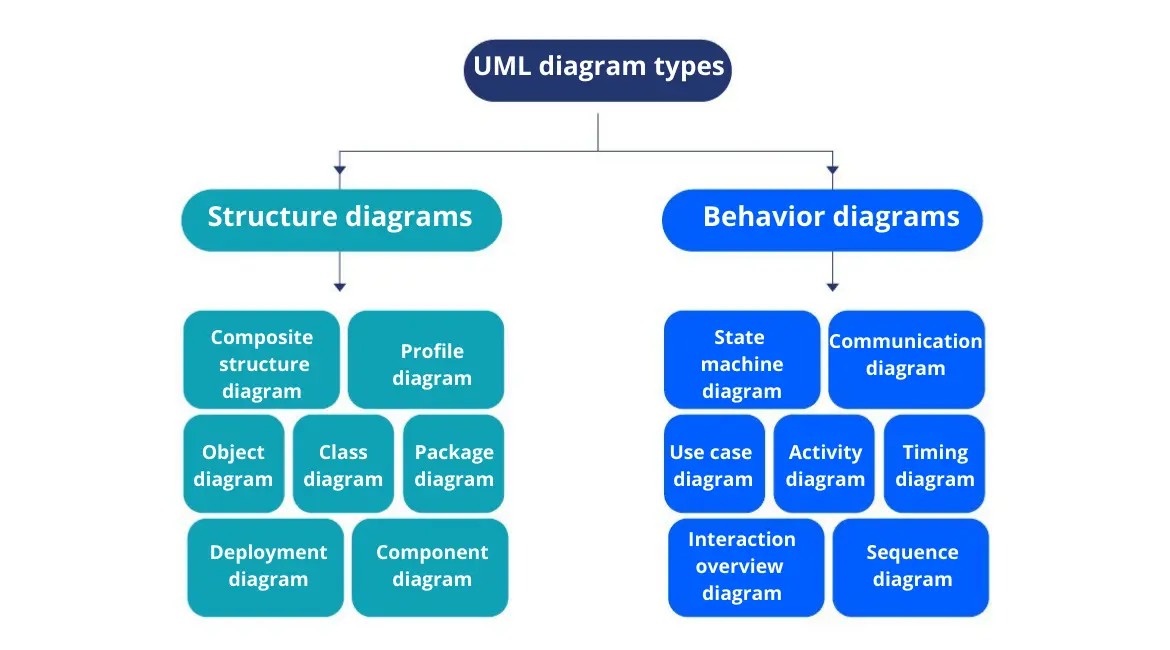
UML diagram types
If you’re curious about other diagram types that use UML, read more about them in UML diagram types: everything you need to know and UML relationships articles.
Make your own UML sequence diagram with Gleek.
Activity diagrams
Activity diagrams show the order or flow of operations in a system. They are similar to flowcharts, and show the outcomes of each action, and actions that happen after specific responses. While they can be either concurrent or sequential, all activity diagrams have a beginning and an end state.
Notations and symbols
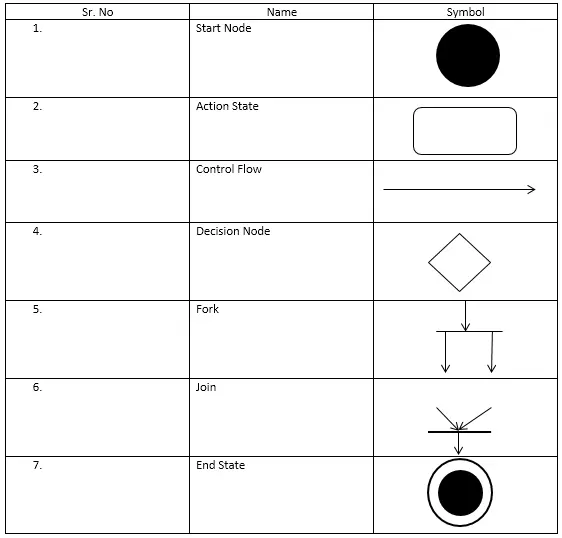
Activity diagrams have special UML symbols that easily tell the reader what the item is and which way the action flows. There are many UML symbols and notations used in activity diagrams, but these are some of the most common ones you’ll see.
Initial state (start point) – Represented by a small, filled-in circle, the start point is where the activity diagram begins. The arrow attached shows the first action that takes place when the sequence starts.
Action flow – These arrows show the flow of one action into another. They are represented simply with an arrow, attached to a start point or action state.
Action/activity state – Usually in an oblong circle or unboxed, this is the action that is performed by an object.
Object flow – Sometimes, actions create or change objects. When an object flow arrow goes from an action to an object, it means that the object was changed or created. However, when the object flow arrow goes from an object to an action, it means that the action state uses the object in some way. Objects are usually represented in rectangular boxes.
Branches and decisions – When there are two or more possible outcomes to an action, this fork in the road is represented with a diamond shape. Here, a decision must be made to determine the action flow.
Guard symbols – At decision nodes, there may be conditions that must be true before one of the actions can occur. These conditions are called ‘guards’, and are largely optional.
Fork and join nodes – Fork and join nodes either split actions, or bring them together, and both are represented with thick, horizontal lines. Fork nodes split one action flow into multiple outgoing flows, and a join node combines multiple incoming flows into one outgoing flow. When both are used together, it is referred to as ‘synchronization’.
Final state (end point) – When the action sequence is finished, you reach the end point. The end point is represented as a full circle, enclosed in a hollow circle, with an action flow arrow pointing towards it.
Check out the comprehensive guide where we compare the Activity diagram with another UML diagram, State Machine.
Sequence diagrams
Sequence diagrams are classified as interaction diagrams, and they visualize how objects collaborate, and focus on the order or time in which they happen. They show end use cases, user and system interactions, and system to system interactions. Sequence diagrams are organized by object and time, which are, respectively, aligned on the vertical and horizontal axes.
Notations and symbols
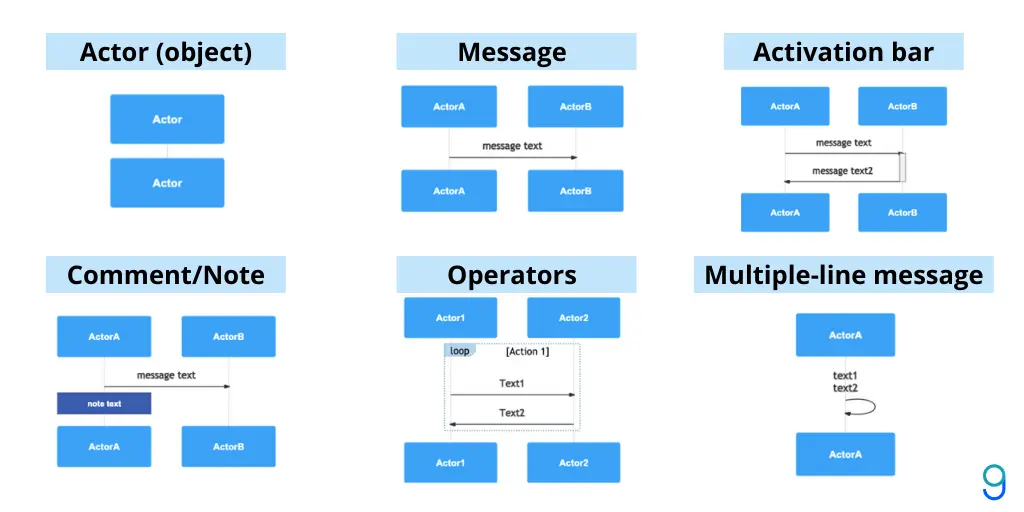
Most of the symbols and notations in sequence diagrams are related to messages and objects. Note that not all of the message types are shown here.
Actors – Actors can either be a user, or some other otherside process that instigates the sequence shown in the diagram. Usually actors are represented with a human-shaped figure, but can also be a rectangular box.
Make your own UML sequence diagram with Gleek.
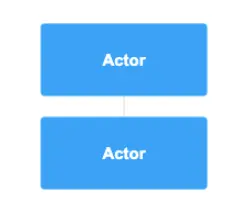
Actors in the sequence diagram
Lifeline – Lifelines show objects and processes that occur during the sequence, and are shown as dotted lines.
Activation box/bar – Thin, rectangular boxes on lifelines show the reader that an operation is performed by the object that is connected to the lifeline. The start and end times of the operation are shown as well. Meaning, the longer the activation box, the more time is needed to complete the operation.
Activation bar
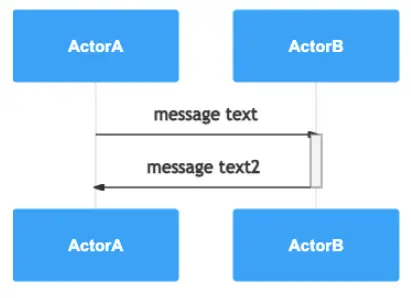
Call message – A solid line with an arrow shows when an object requests an action from another object or entity.
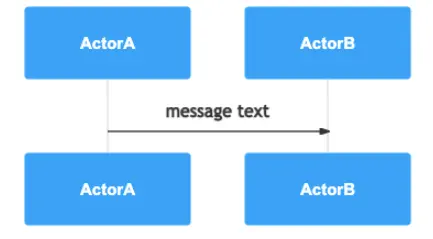
Call message
Return message – Return messages are responses to call messages, sent from the recipient object back to the call object. Like lifelines, these are dotted lines, but they also have an arrow attached.
Destroy message – Represented by an X on a lifeline, a destroy message stops or destroys an object in the sequence.
Note – Sometimes developers need to include information that can’t be shown on the diagram. So, they do this with notes, which are usually set off to the side, and not attached to any lifelines.

Note in sequence diagram
Sequence fragments – These are parts of the interactions within a sequence, and are shown in a box. To learn more about these special notations, check out our recent post on sequence diagrams and fragments. Here are some of the most common sequence fragments:
Alt – Short for alternative multiple fragments, this is a collection of more than one interaction, and only the one whose conditions are met will execute.
Opt – Similar to alt fragments, ‘optional’ fragments will only execute if their conditions are met.
Par – Meaning parallel, these two fragments run side by side, or at the same time.
Loop – As the name suggests, loop fragments may execute more than once.
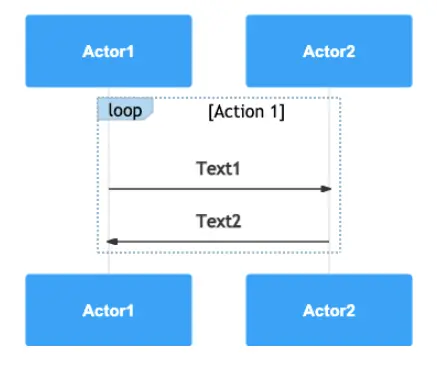
Loop fragment
Comparing activity and sequence diagrams
Both of these diagram types are classified as behavior diagrams, and though they have similar uses, their focuses are different. The main difference between activity and sequence diagrams is that activity diagrams focus on the flow of activities, whereas sequence diagrams focus on how objects interact with each other over time. Activity diagrams show the workflow and how objects interact with each other, and sequence diagrams look at the messages sent between objects over time.
Make your own UML sequence diagram with Gleek.
Sequence diagrams in Gleek
Looking to create your own sequence diagram? Have a look at our recent post that will give you a full tutorial on how to create a sequence diagram in Gleek. Check out more detailed explanation of how to create sequence diagrams for user login, ATM withdrawal, as well as online shopping system.
Gleek is a text-based diagramming tool used by software developers to make diagrams without ever touching a mouse. Get started for free today.
Related posts
System Sequence Diagrams vs. Sequence Diagrams in UML
Top 8 UML sequence diagram tools