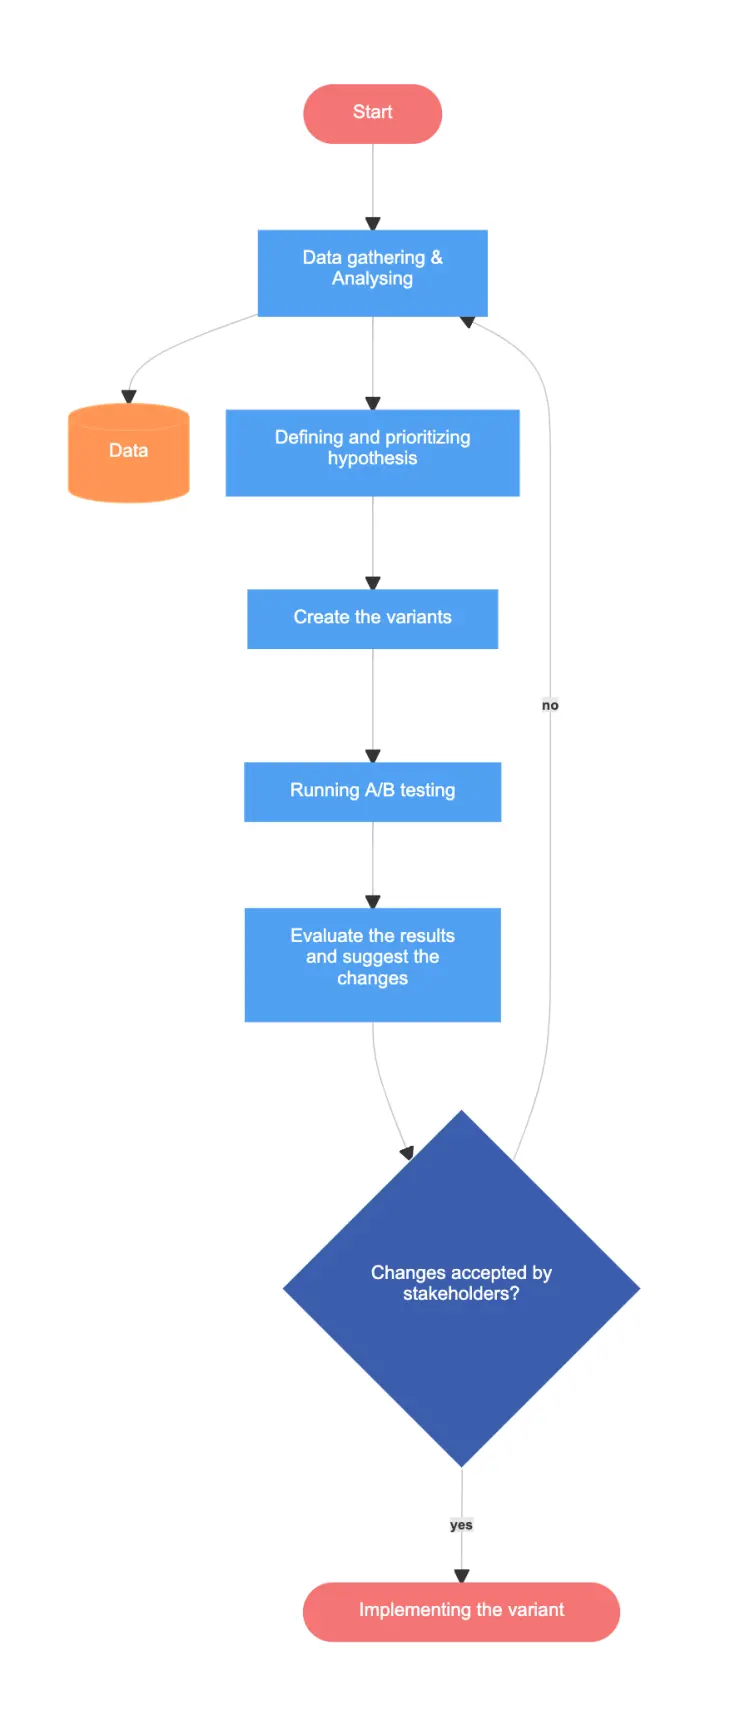
The flowchart starts with data gathering and analysis. Then, the team sets a hypothesis. When it is done, the variants are created and A/B testing begins. After A/B testing is over, the team evaluates the results and suggests changes. If stakeholders don’t accept the changes, the data gathering and analyzing processes start over. If the stakeholders accept the changes, implementation of the variants begins.
Edit this diagram in Gleek
A/B testing diagram code in Gleek
Start:queue
Data gathering & Analysing
Data:db
Defining and prioritizing hypothesis
Create the variants
Running A/B testing
Evaluate the results and suggest the changes
Changes accepted by stakeholders?:diamond
Implementing the variant:queue
Start–>Data gathering & Analysing
Data gathering & Analysing–>Data
Data gathering & Analysing–>Defining and prioritizing hypothesis
Defining and prioritizing hypothesis–>Create the variants
Create the variants–>Running A/B testing
Running A/B testing–>Evaluate the results and suggest the changes
Evaluate the results and suggest the changes–>Changes accepted by stakeholders?
Changes accepted by stakeholders?-no->Data gathering & Analysing
Changes accepted by stakeholders?-yes->Implementing the variant
About Flowcharts
A flowchart, or flow chart, is a type of diagram that shows a step-by-step view of a process. Flowcharts document the tasks and decisions needed to achieve a specific goal. A basic flowchart is easy to make and understand. Businesses, engineers and software designers often use flowcharts to diagram their ideas.
Similar flowchart examples
Content marketing process flowchart
Performance marketing strategy flowchart
Lead generation with LinkedIn Sales Navigator flowchart