
Understanding the flow of operations and transactions is a corner stone for both development and analysis in case of payroll systems. This is where a state diagram becomes an invaluable tool. A state diagram for a payroll system not only visualizes the operational workflow but also helps in identifying potential bottlenecks, optimizing processes, and ensuring accuracy in employee payment processing.
Grasping the intricacies of a payroll system through a state diagram can significantly improve your ability to manage, modify, and communicate the system's functionalities - whether you are a software developer, system analyst, or HR professional.
By the end of this article, you will have a clear understanding of what a state diagram is, its key components, what specifics you need to consider for a payroll system, and how to draft a comprehensive diagram using an intuitive tool such as Gleek.
What is a State Diagram?
At its core, a state diagram, also known as a state machine diagram, serves as a dynamic blueprint of how a system behaves in response to external and internal events. It maps out the various states a system can be in at any given time and elucidates the transitions between these states triggered by specific events. This type of diagram belongs to the family of UML behavioral diagrams, which are used extensively in software and systems engineering to model the dynamic aspects of systems.
Create your own State diagram with Gleek.
The Significance of State Diagrams
The true power of state diagrams lies in their ability to offer a clear and concise visual representation of how a system behaves over time. They:
Simplify the understanding of complex systems by breaking down their behavior into manageable states and transitions.
Help in identifying potential issues such as states that can't be reached or exited, which might indicate bugs in the system.
Facilitate communication among team members and stakeholders by providing a common language and visual reference for the system's functionality.
Assist in the design and testing phases of system development, ensuring that all possible states and transitions are accounted for and handled correctly.
How to Make a State Diagram?
Creating a state diagram involves a systematic approach that begins with identifying the different states that a system can occupy and understanding the events that cause transitions between these states. This section will guide you through the process of making a state diagram, emphasizing the identification of components and the relationships among them.
Components of a State Diagram
To construct an effective state diagram, it's essential to familiarize yourself with its primary components. Each component plays a critical role in detailing the system's behavior and interactions. The main components include:
States: These are representations of various conditions or situations that the system can be in at any given moment. States are usually depicted as rounded rectangles or circles, labeled with the name of the condition they represent.
Transitions: Illustrated by arrows, transitions show the movement from one state to another. They represent the response of the system to certain events or conditions, effectively changing the state of the system.
Initial and Final States: Depicted by a circle with a dot inside or a double circle, denote the end(s) of the process. These symbols collectively outline the lifecycle of a system from beginning to completion within the diagram.
Drafting a State Diagram
To draft a state diagram, follow these steps:
Define the Scope of the System: Understand what part of the system or process you are modeling. A clear scope helps in focusing on relevant states and transitions.
Identify All Possible States: Start by listing out every state the system can be in. Think about the various phases of the process or system you are modeling.
Determine Events and Transitions: For each state identified, consider what events can cause the system to change to another state. These will form the transitions in your diagram.
Map Initial and Final States: Clearly mark where the process starts and, if applicable, where it ends. This helps in understanding the flow and completion of the system's process.
Draw the Diagram: Using the components identified, begin sketching the diagram. You can start with the initial state, then add states and transitions as you map out the process flow. Make sure each state and transition is clearly labeled.
Review and Refine: Once your diagram is complete, review it for accuracy and completeness. Make sure every possible state and transition is included and that the flow makes logical sense.
Create your own State diagram with Gleek.
What Do We Need for Payroll System State Diagram?
Creating a state diagram for a payroll system using Gleek involves several key components. Each of these components plays an important role in accurately representing the process and ensuring the diagram is clear, efficient, and precise.
Start and End Symbol:
Start and End Symbols [O] are used to denote the beginning and conclusion of the payroll process. They provide a clear indication of the process's lifecycle and help viewers understand the flow from start to finish.
States:
Idle: This state is where the system waits for input or actions. It serves as the starting point of the process.
EmployeeAdded: After adding an employee, the system transitions to this state. Here, users can view or edit employee details.
ManagerMenu: Upon logging in as a manager, this state presents a menu with options for managerial tasks.
EmployeeUpdated, PayrollApproved, ReportGenerated: These states represent various stages of the process and loop back to the idle state after completion.
Composite State:
Idle: Represents a composite state where multiple actions can occur, including adding employees, calculating payroll, and manager login.
Transitions:
Transitions are represented by arrows (-->) and show the progression from one state to another.
Managerial Actions:
ManagerLogin: Allows managers to log into the system and access managerial functionalities.
ManagerLogout: Enables managers to log out of the system after completing tasks.
ApprovePayroll: Allows managers to approve payroll processing.
GenerateReport: Enables managers to generate reports.
Employee Actions:
AddEmployee: Allows users to add new employees to the system.
ViewEmployee, EditEmployee: States for viewing and editing employee details.
End State:
End: Indicates the end of the process. Once the system reaches this state, the payroll process is considered complete.
Creating a State Diagram for a Payroll System in Gleek: A Step-by-Step Guide
This guide walks you through creating a comprehensive state diagram for a payroll system using the Gleek app. By following these steps, you'll be able to visually represent the payroll process, making it easier to understand and optimize.
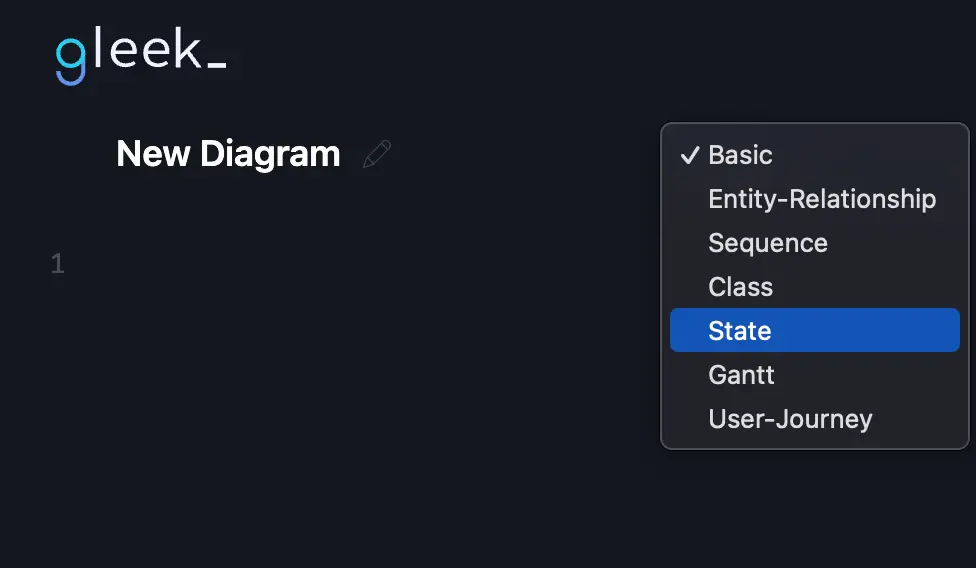
Step 1: Launch Gleek App
Open your web browser and go to the Gleek app website. Make sure you're logged into your account. Click on 'New Diagram' and from the dropdown menu, select 'State' to start your new diagram.
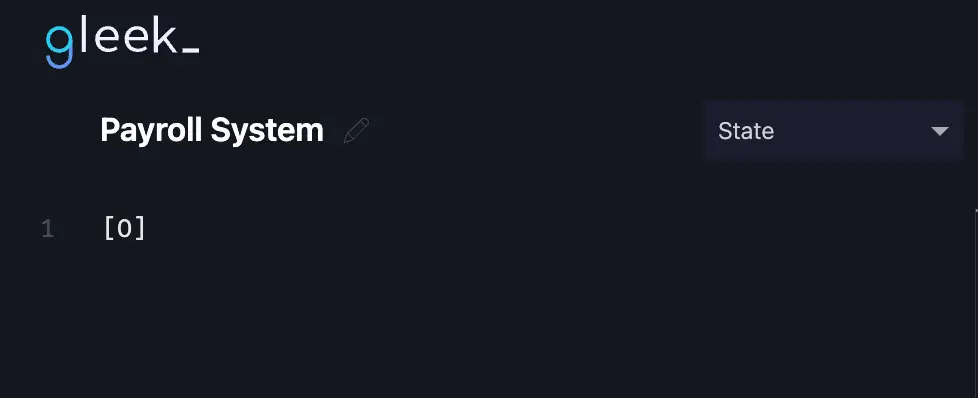
Step 2: Initiate the Process
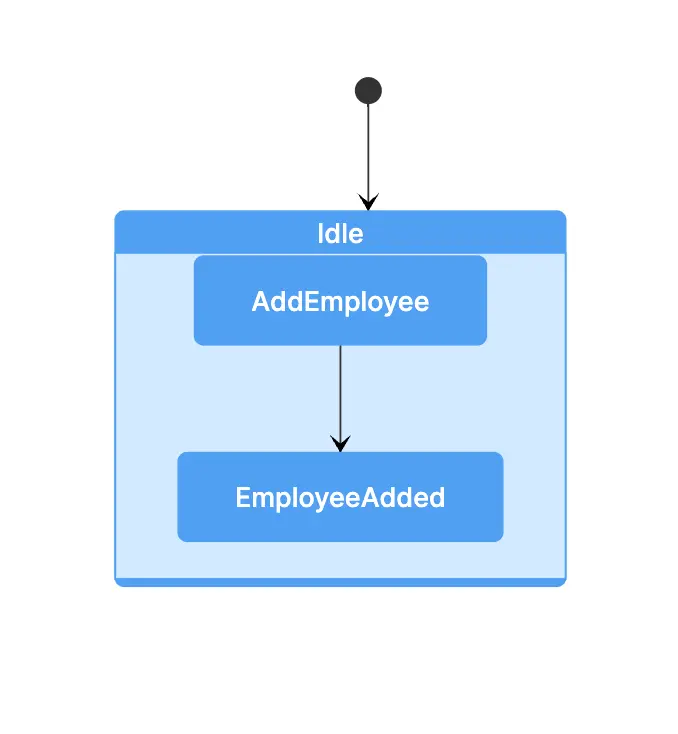
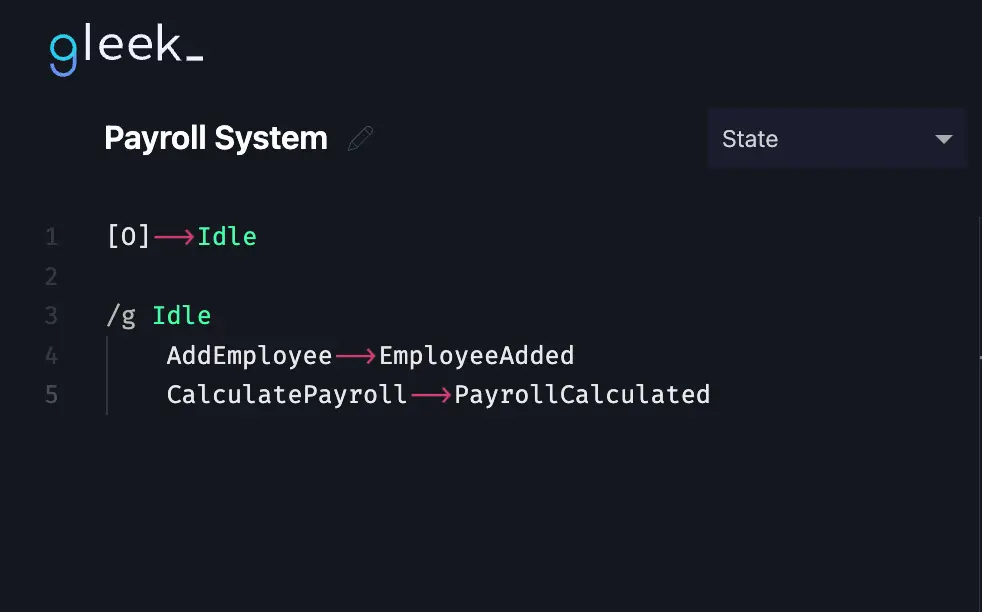
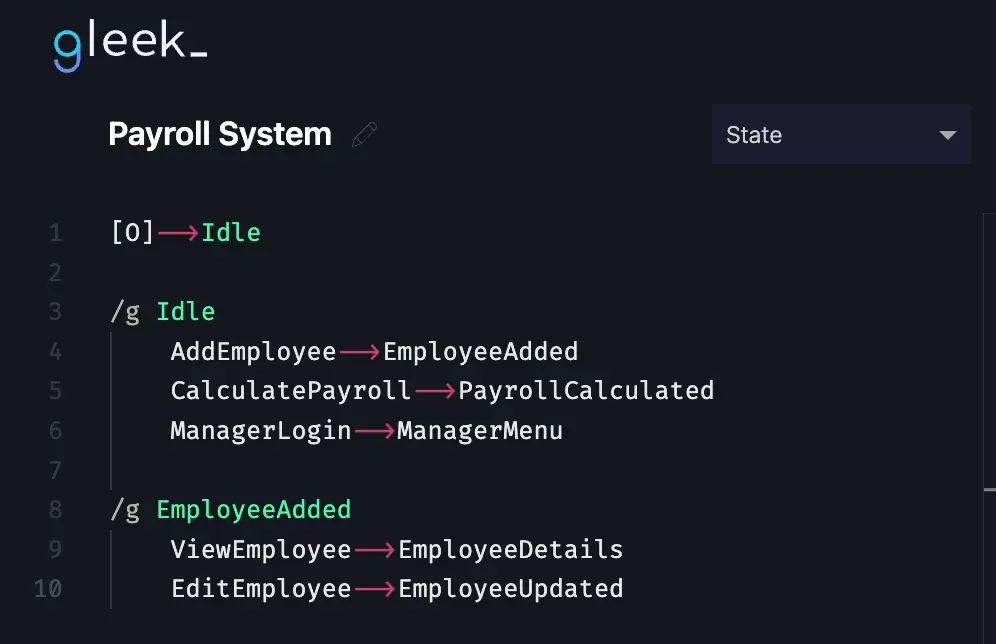
Begin by typing [O] to mark the start of the payroll process. This symbol denotes the beginning of the process flow in your state diagram.
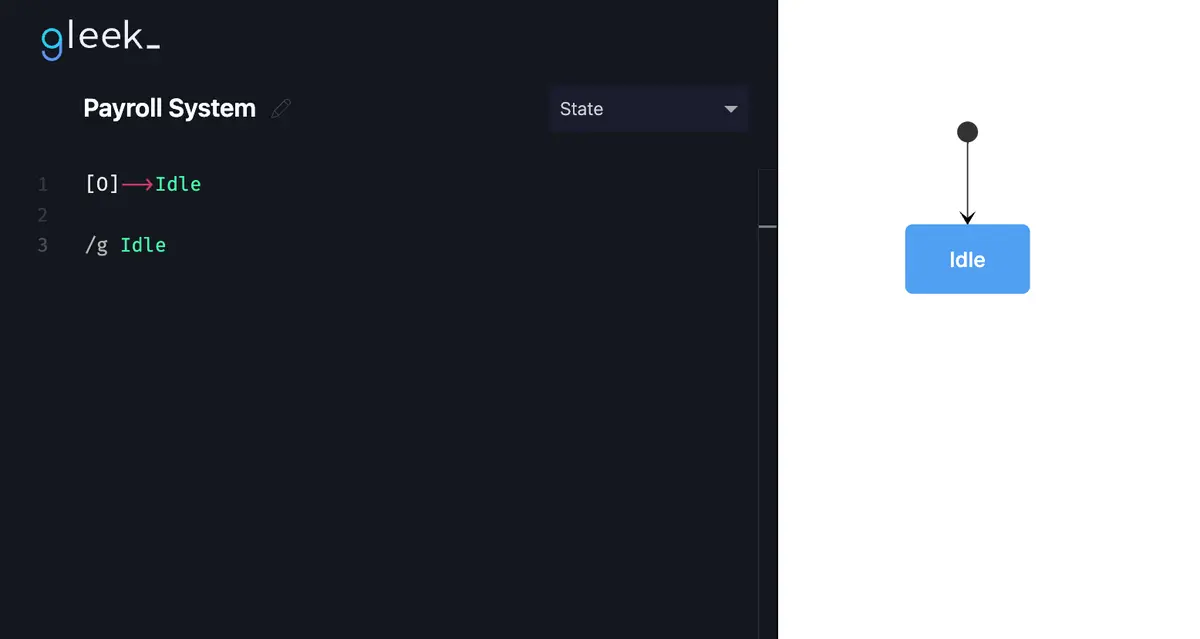
Step 3: Create the Composite State
In our state diagram, the 'Idle' state acts as a composite state, indicating a phase where the system is ready to receive input or perform actions. To denote this in Gleek, type /g Idle. This notation sets the groundwork for detailing the various processes that can occur from this idle state.
Check out our blog on how to create a State diagram for a Student Registration Process.
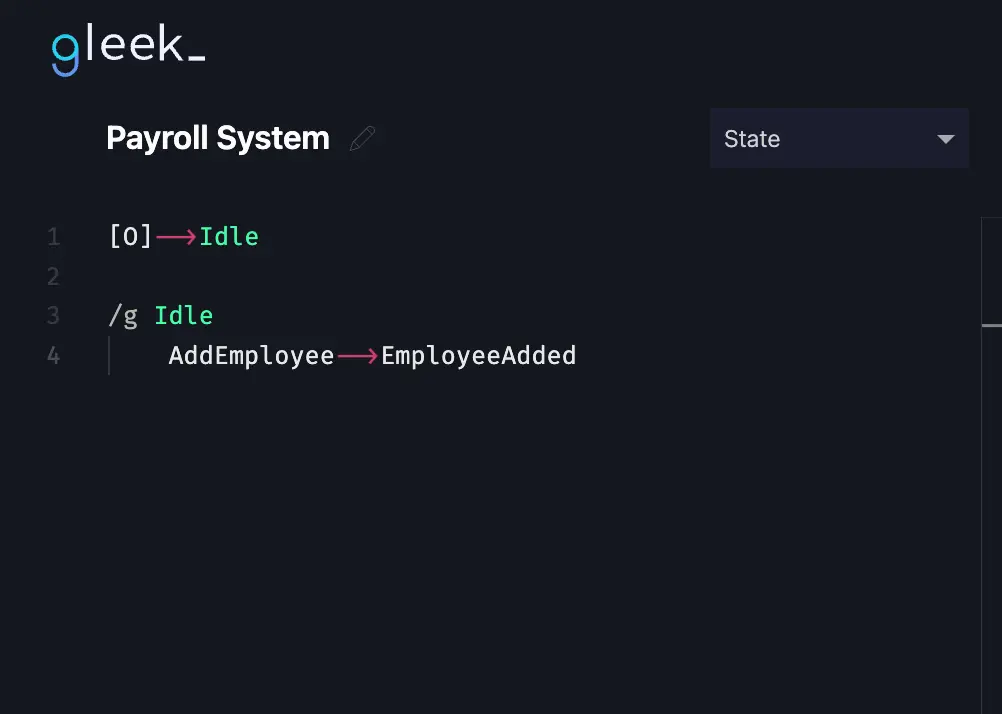
Step 4: Detail the Processes
Under the composite state 'Idle', we'll describe the sequence of processes integral to the payroll system.
Create your own State diagram with Gleek.
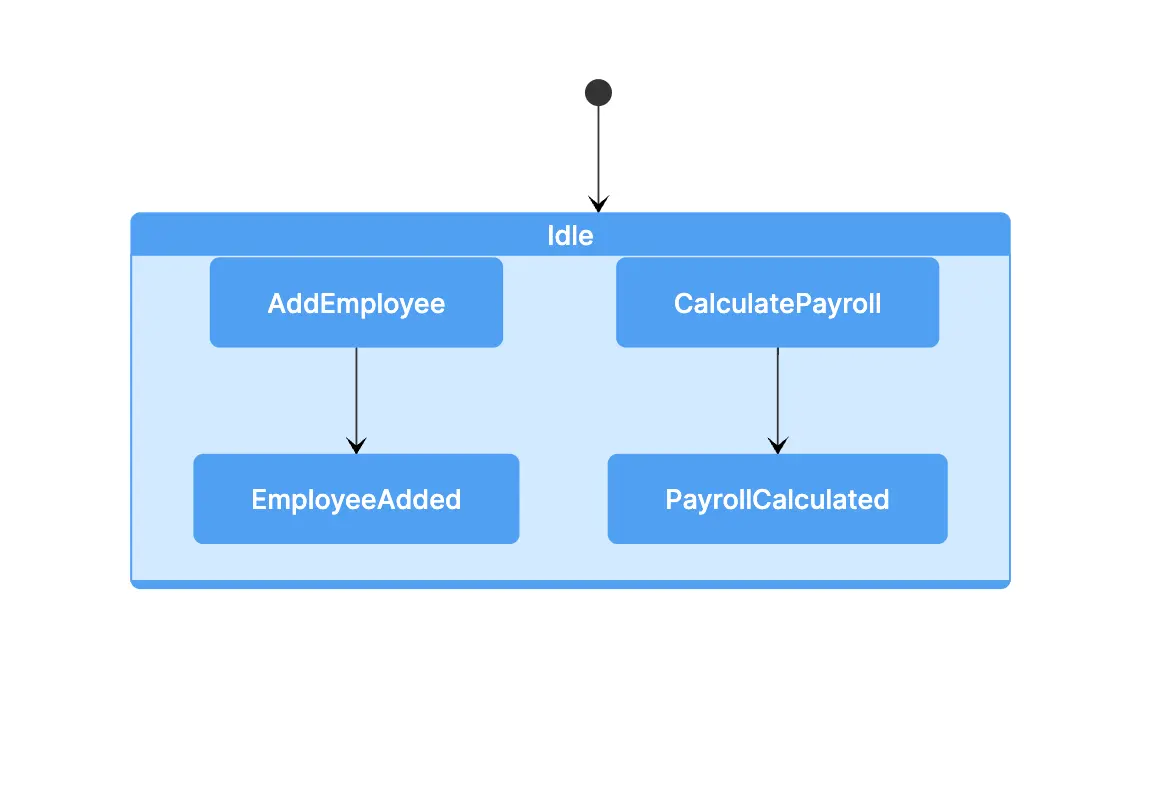
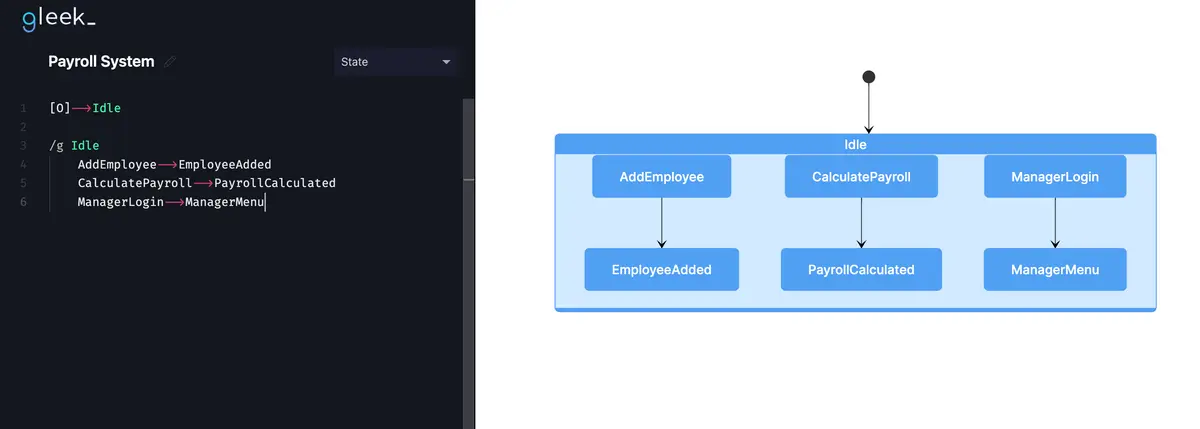
AddEmployee: Begin a new line, press TAB, and type "AddEmployee" to illustrate the start of this process. This action allows for the addition of new employees into the system, a foundational step for payroll management. After adding an employee, a transition occurs to the 'EmployeeAdded' state. Connect these states by typing 'AddEmployee --> EmployeeAdded'.
CalculatePayroll: This action transitions the system to the 'PayrollCalculated' state, highlighting the payroll processing phase. It is crucial for determining each employee's compensation based on hours worked, benefits, and deductions.
ManagerLogin: This process transitions to the 'ManagerMenu' state, providing managers with access to administrative functionalities within the system.
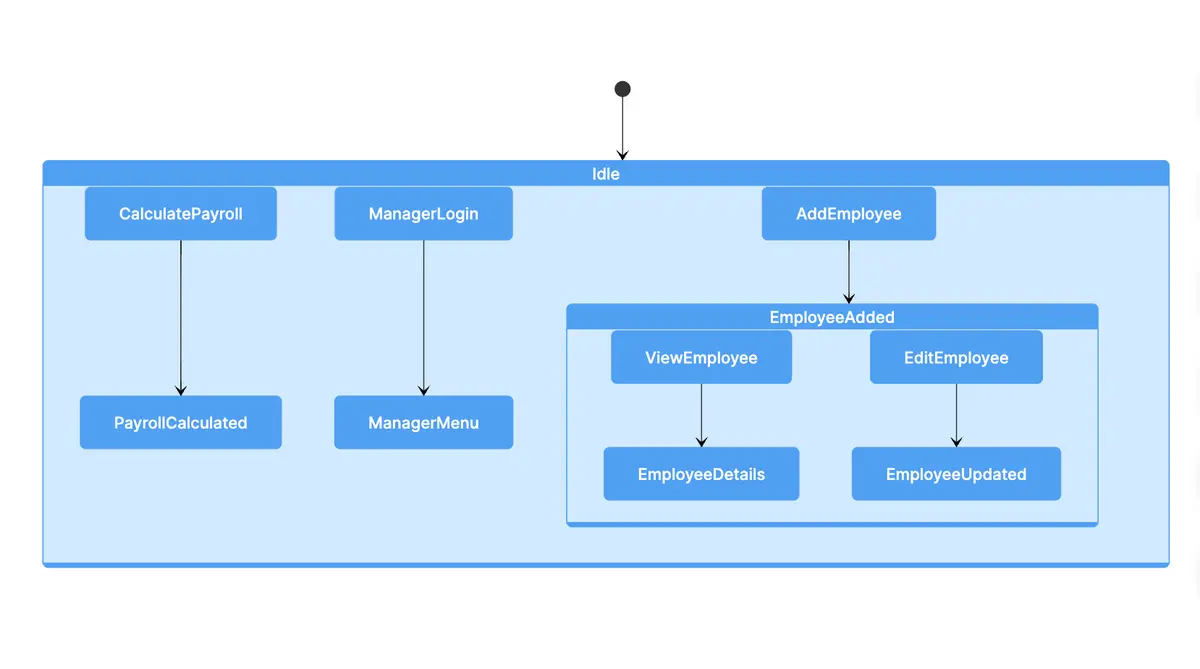
EmployeeAdded State:
Upon transitioning to the 'EmployeeAdded' state, two key actions are available:
ViewEmployee: Moves the system to the 'EmployeeDetails' state, allowing for the viewing of employee information.
EditEmployee: Leads to the 'EmployeeUpdated' state, enabling modifications to employee details.
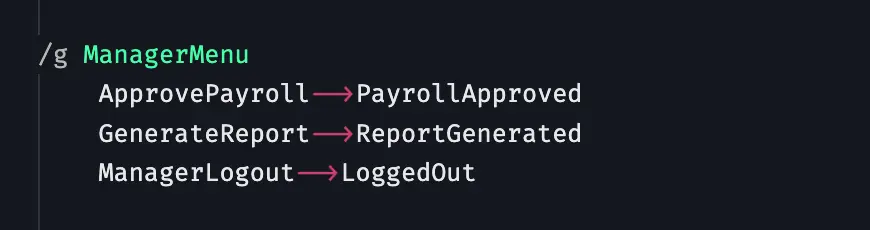
ManagerMenu State:
After a manager logs in, several options become accessible:
ApprovePayroll: Advances the system to the 'PayrollApproved' state, where payroll processing receives approval.
GenerateReport: Shifts to the 'ReportGenerated' state, facilitating the generation of various reports.
ManagerLogout: Transitions the system back to the 'LoggedOut' state, marking the completion of managerial tasks.
Lastly, let's finalize our payroll system diagram by connecting the 'Idle' state to [O], which indicates the end of the process.
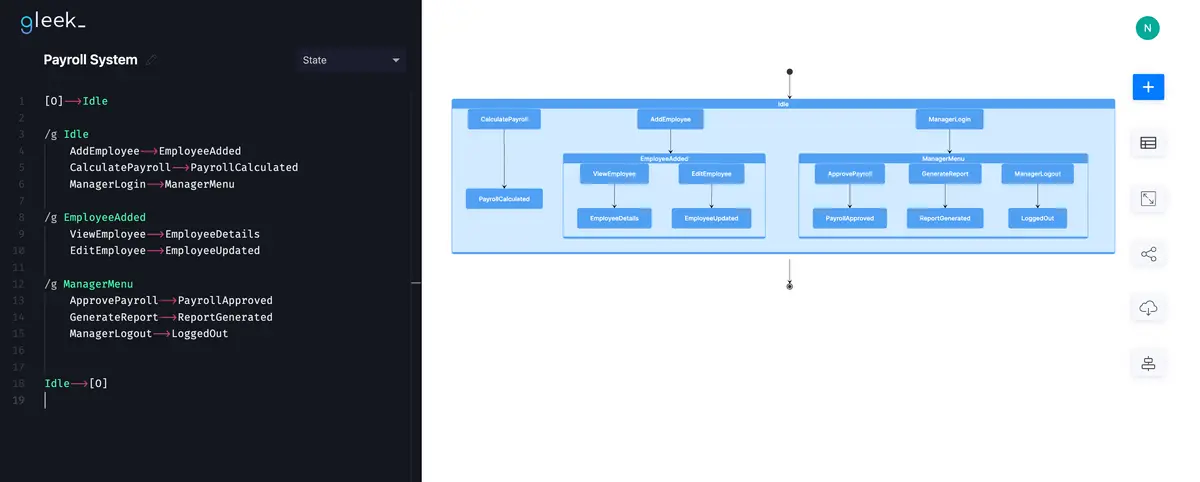
Final Steps:
After laying out all processes and transitions, review your diagram to ensure accuracy and completeness. Gleek’s intuitive interface allows you to easily adjust and refine your diagram as needed. Once satisfied, you can export the diagram for sharing or use it as a reference tool to enhance understanding and management of the payroll system.
Create your own State diagram with Gleek.
By following these steps, you create not just a visual representation but a comprehensive narrative of your payroll system's operations, encapsulated within a clear and accessible state diagram.
However, our exploration of Gleek's capabilities is far from over. Gleek goes beyond merely crafting state diagrams; it's an AI-enhanced diagramming platform designed to streamline your diagramming workflow. Gleek enables you to create a wide array of diagrams such as class, sequence, user journey, entity-relationship diagrams, and even Gantt charts effortlessly, all with keyboard commands.
Keep an eye out for more tutorials as we continue to explore the range of diagrams you can design with Gleek. Delve into the world of keyboard-driven diagramming and enhance your diagram creation skills with Gleek!
Related posts
State diagram for student registration process with Gleek app
State machines vs. Activity diagrams: Simplifying workflow visualization